

When Does A Second Job Actually Help Your Life, Not Drain It?
EDA : Time, money, and stress patterns of people juggling a main job and a passion project.
Most people start a side hustle with the same hope: a little more money, a little more freedom, maybe a path out of a job that feels like it’s going nowhere. But somewhere between late-night emails, weekend deadlines, and never-ending to-do lists, that second job can quietly stop being an opportunity and start becoming a slow leak on your energy, health, and relationships. The line between “smart extra income” and “self-inflicted burnout” is thinner than it looks.
In this article, we’ll dig into real patterns from thousands of people juggling a main job and a passion project: how they spend their time, how much money actually moves the needle, and where stress begins to spike instead of pay off.
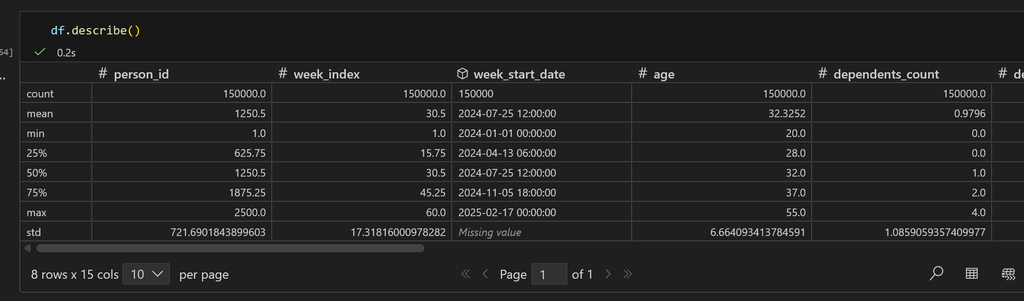
This dataset is a week-by-week view of 2,500 workers tracked over 60 weeks (150,000 rows in total), from early 2024 into 2025. For each person and week, we see their age, dependents, main job and side-hustle hours, income from each job, plus sleep, stress, happiness, energy, and basic financial pressure via debt-to-income ratio. In other words, it’s not just “who has a side hustle,” but a full time–money–wellbeing diary that lets us see how different hustle patterns actually play out in real life over time.
And before diving into deeper analysis, we’ll first get to know the shape of how different side hustle stages are distributed across age, country, gender, and job type, and how time, money, and stress show up at a high level. This quick “lay of the land” helps us see what’s typical, what’s rare, and where interesting outliers might be hiding so the next insights we build aren’t just interesting, but properly grounded in how the real sample actually looks.
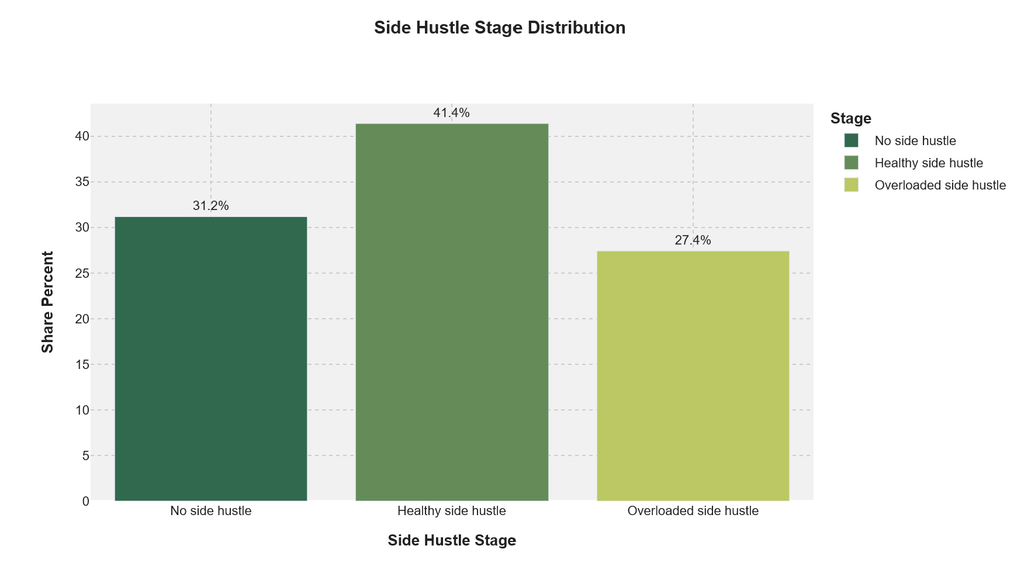
When we zoom out and look at the crowd overall, the biggest group isn’t actually people with no side hustle. The largest slice about 41% are in the “healthy side hustle” zone: they do have a second job or project, but it still seems to fit reasonably well into their life. Another 31% have no side hustle at all, meaning they’re fully focused on their main job.
The group to keep an eye on is the remaining 27% in the “overloaded side hustle” stage. That’s roughly 1 in 4 people whose second job is no longer just “extra income,” but is starting to feel like extra weight. Even from this first snapshot, we can already see two stories: many people are managing to keep their side hustle in a healthy place, but the door to overload is wide open and that’s exactly what we’ll dig into next.
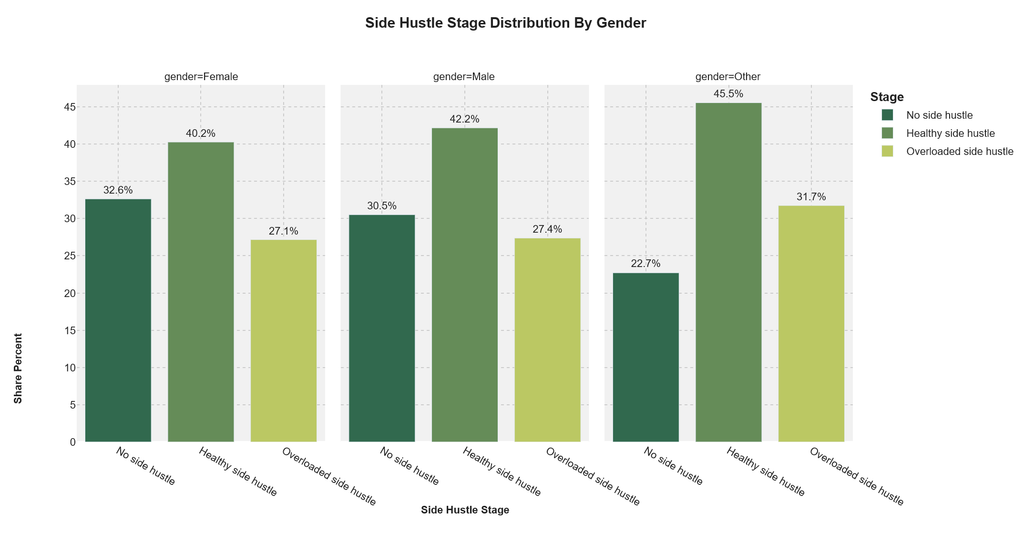
When we split the stages by gender, the basic pattern holds for everyone: the biggest group in each column is people with a healthy side hustle. Around 40–42% of women and men land in that middle zone, and it’s even higher about 45.5% for the “Other” group. “Other” here doesn’t mean a specific third gender; it simply captures everyone who didn’t select strictly “male” or “female” or chose another identity option. So you can read it as a mixed bucket of non-binary, prefer-not-to-say, or alternative labels.
What’s interesting is that this “Other” group also has the lowest share with no side hustle (about 22.7%) and the highest share of overloaded side hustles (about 31.7%). In other words, people in this bucket are the most likely to be doing some form of side hustle, and more of them are crossing into overload compared with men and women. Women and men look quite similar to each other: roughly one-third with no side hustle, just over 40% in the healthy band, and around 27% overloaded.
How do main job hours, side hustle hours, and total work hours differ between “No”, “Healthy”, and “Overloaded” side hustles?
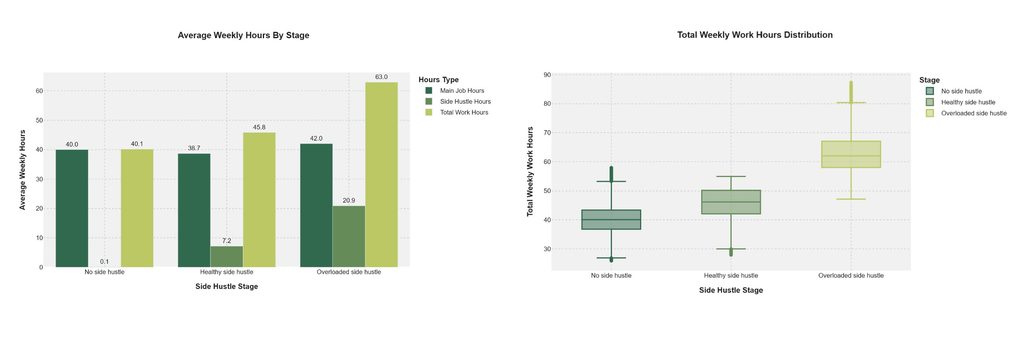
Once we bring working hours into the picture, the three stages start to look very different. People with no side hustle are pretty much living the “classic” schedule: around 40 hours a week on their main job and basically nothing on the side, so their total work week hovers right at that 40-hour mark. The healthy side hustle group shaves their main job down a little to about 38–39 hours, then adds roughly 7 hours on their side project. That puts them at around 46 hours total like quietly tacking on one extra workday spread across evenings and weekends, but still in a range that many people can juggle.
The overloaded side hustle group is a different world. Their main job actually nudges up to about 42 hours, and on top of that they’re putting in an average of 21 hours on their side hustle. That’s a 63-hour week basically one full-time job plus a solid part-time job layered on top. The boxplot on the right shows how intense this gets for some people: while “no side hustle” and “healthy” workers mostly sit in the 40–50 hour band, overloaded workers routinely push past 60 hours, with a chunk stretching into the 70–80 hour territory.
In other words, the line between “healthy” and “overloaded” isn’t just a mood; it’s a jump from “a bit extra” to “living in permanent overtime.”
Does weekly income from the side hustle change total income, or it is the uplift material compared to main job income?
Now that we’ve seen how side hustles change people’s weekly hours, the next question is simple: does the money justify the grind? In this section we look at how much income actually comes from the side hustle, how big that uplift is compared to the main job, and whether it truly moves someone’s total weekly income into a different league or just adds a thin extra layer on top of the salary they already earn.
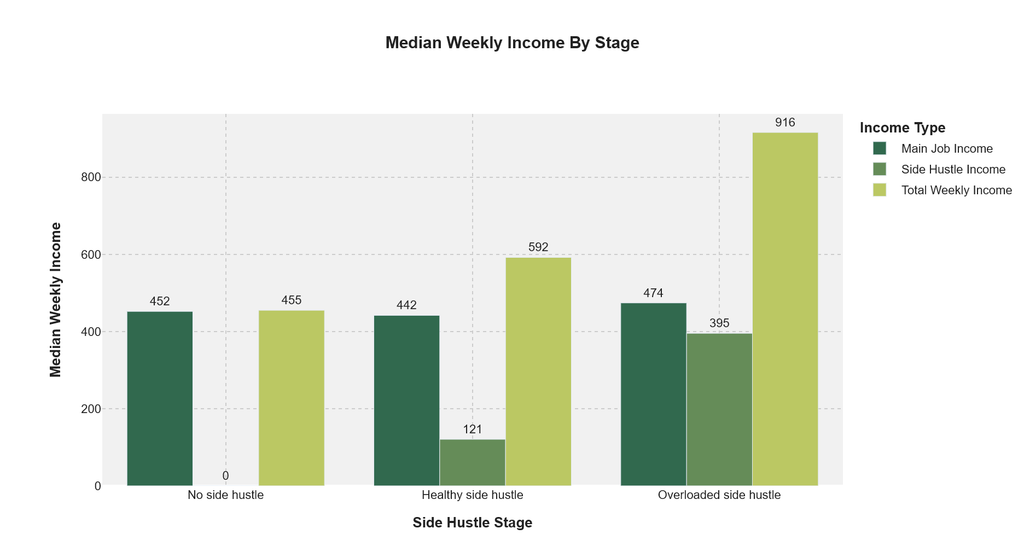
Here the money story gets more concrete. People with no side hustle sit at a median of about $452/week from their main job and roughly the same in total income. Once a healthy side hustle comes in, main job pay actually dips slightly to around $442/week, but the side hustle adds another $121/week on top. That pushes total weekly income to about $592 roughly a 34% uplift for the person who’s willing to add a small, controlled amount of extra work.
The overloaded side hustlers are the ones really reshaping their income profile. Their main job pays a bit more, around $474/week, but the side hustle itself brings in a hefty $395/week almost as much as the main job. That drives total income up to about $916/week, close to double what the no-side-hustle group makes. So yes, the uplift can be very material, especially in the overloaded stage but it’s coming with the kind of time and energy cost we saw earlier, which raises the big question: when does “more money” stop being a smart trade for how you actually live your week?
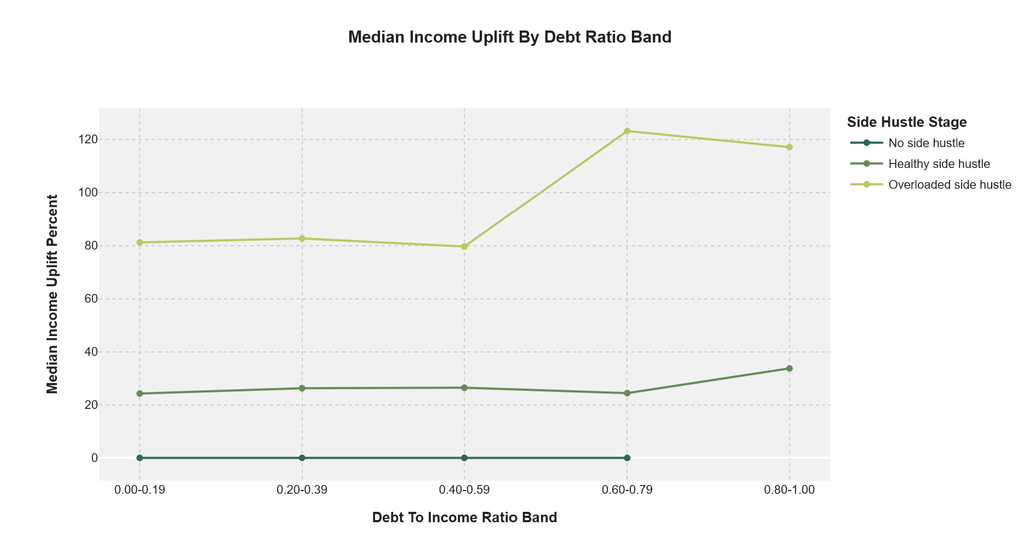
This connects the dots of income story to financial pressure. People with no side hustle sit flat at 0% uplift by definition whatever they earn comes from the main job only. Healthy side hustlers consistently add about 24–27% extra income across most debt bands, and that bump actually climbs to roughly one-third more income for those with the highest debt-to-income ratios (0.80–1.00). In other words, when debt starts to feel heavy, even the “healthy” crowd seems to lean a bit harder on their side hustle to create extra breathing room.
For overloaded side hustlers, the pattern is much more intense. Even at low debt levels, they’re already doubling their income: around 80–83% uplift when debt is under 0.4. But once their debt-to-income ratio crosses 0.60, the uplift jumps above 120% their side hustle is adding more than a full extra main job’s worth of income just to keep up.
That suggests a tough dynamic: the more debt people carry, the more likely the side hustle shifts from a “nice-to-have” accelerator into something that feels like a survival engine, especially for those already in the overloaded zone.
Sleep and Rest: How Much Does a Side Hustle Steal Your Sleep?
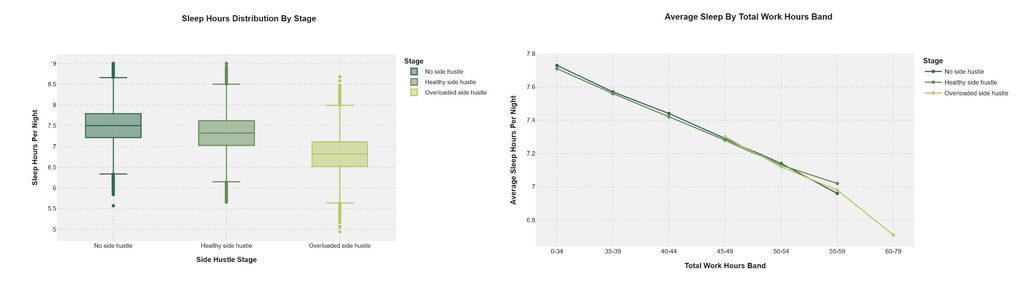
Sleep is where the “hidden cost” of a side hustle really shows up. If you just look at stages, people with no side hustle and those with a healthy side hustle sleep almost the same: the typical person in both groups sits around 7.3–7.6 hours per night, with a decent chunk still getting close to 8. The overloaded group is the one that clearly bends down: their median sleep drops into the 6.7–7.0 hour range, and you see more people slipping below 6 hours. It’s not a dramatic collapse, but it is a consistent erosion of rest once the second job stops being “light.”
When you slice sleep by total work hours, the pattern becomes even clearer. Across all stages, people working under 35 hours a week are near the 7.7–7.8 hour mark. From there, every extra band of work time shaves off a bit of sleep, until those clocking 60–79 hours a week are down around 6.7 hours on average. In that highest-work band, the overloaded side hustlers sit at the very bottom of the lines meaning that once you push into serious overtime territory, it’s usually the overloaded crowd paying for it with the most lost sleep.
At what band of total work hours do we see happiness scores start to fall and stress scores spike, especially for side hustlers?
We’ve seen how time, money, and sleep shift as a side hustle grows but the real make-or-break is how it feels to live that life. In this next part, we look at stress and happiness together to find the tipping point: the zone where extra work still feels empowering and under control, and the point where it quietly flips into “too much.” By tracking both scores against total weekly work hours, we can see where the curve bends when stress keeps climbing, happiness starts sliding, and side hustlers (especially the overloaded ones) begin paying an emotional price for their extra income.
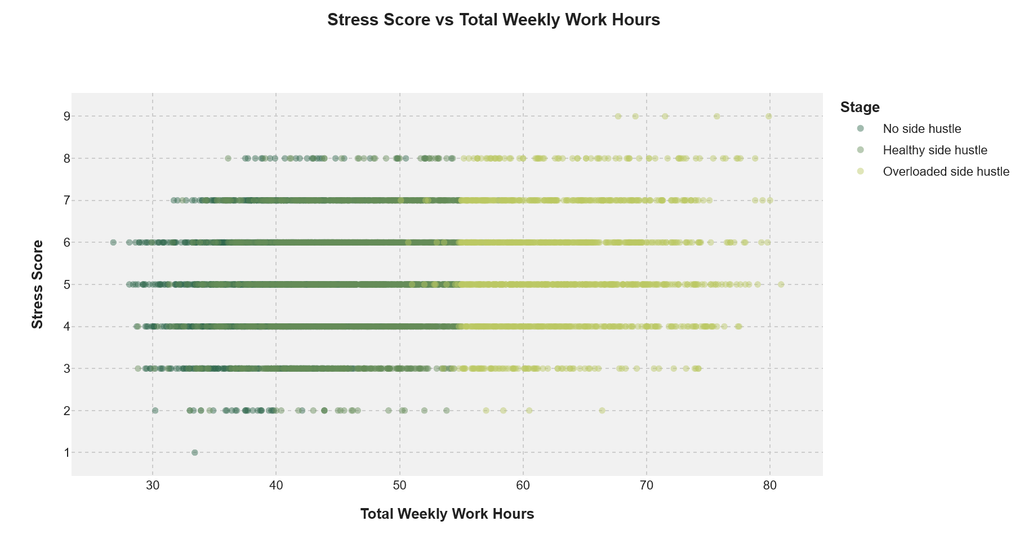
On the stress side, the pattern is pretty clear: more hours = more yellow = more stress. At 35–45 total hours a week, most people across all stages cluster around stress scores of 3–5. There are some 6s and 7s, but they’re more scattered, and you still see plenty of darker dots (no side hustle and healthy side hustle) in the lower-stress range.
Once you move past roughly 50–55 hours, the cloud shifts. Stress scores of 6–7 become the “new normal,” and the points start turning much more yellow, meaning overloaded side hustlers are dominating that high-hour zone. By the time you hit 65–80 hours a week, the picture is almost all overloaded workers sitting at 6–8+ on the stress scale. So the tipping point for stress isn’t a sharp cliff, but you can see a clear bend: below about 50 hours, stress is mixed and moderate; above that, high stress becomes the default especially for people stacking a heavy side hustle on top of their main job.
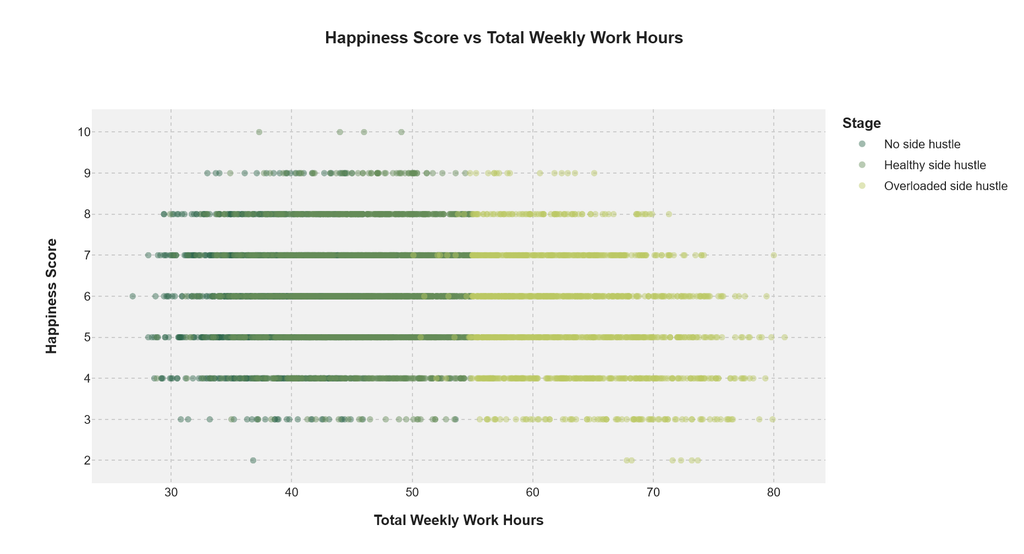
On the happiness side, there is a sweet spot. Between roughly 35 and 50 total work hours per week, you see a strong cluster of scores around 7–9, especially for people with no or healthy side hustles (the darker and mid-green dots). In that range, plenty of side hustlers look genuinely happy: they’re working more, but it still feels rewarding. As total hours creep past 55, the yellow dots (overloaded side hustlers) start to dominate, and their happiness compresses into the 4–6 band. There are still a few outliers who claim 8–9 even at 60–70 hours, but they’re clearly the exception, not the rule.
Putting the two charts together, the trade-off is straightforward: once total work passes about 50–55 hours a week, stress becomes routinely high while happiness steadily thins out, especially for overloaded side hustlers. Below that band, a side hustle can coexist with decent sleep, moderate stress, and solid happiness. Above it, the extra income is increasingly bought with higher stress and a noticeable drop in day-to-day enjoyment.
Energy Profile, Which Hustle Pattern Feels Most Sustainable?
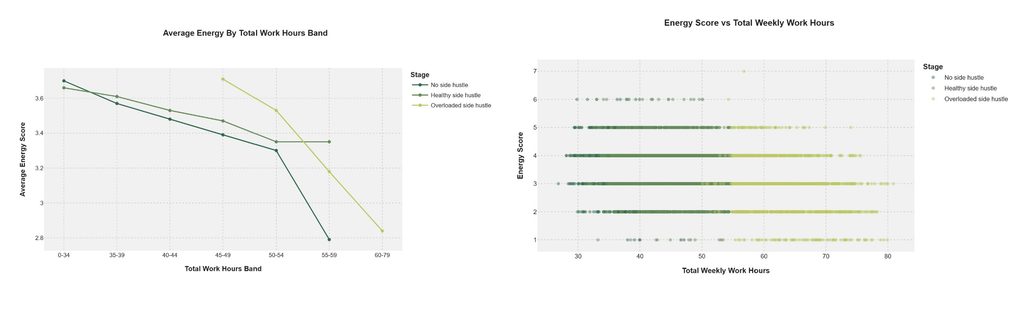
Energy is where the story gets interesting, because the “no side hustle = most rested” assumption doesn’t really hold. In the 0–50 hour range, healthy side hustlers actually edge out everyone else on average energy: they sit slightly above the no-side-hustle group at almost every band, hovering in the 3.5–3.6 zone on a 1–5 scale. That fits the idea of a side project that feels exciting rather than exhausting enough extra work to feel purposeful, not enough to wipe you out. People with no side hustle are steady but a bit flatter: not terrible, not amazing, just “okay” energy in the middle of the week.
The real drop happens once we cross 55+ total hours. At that point both no side hustle and overloaded side hustlers start to slide, but overloaded workers fall the fastest: their average energy sinks toward the low 3s and then below 3 in the 60–79 hour band. The scatter plot on the right backs this up at very high work hours, you see a lot of yellow dots bunched around energy scores of 2–3, meaning “running on fumes.” Put simply: the most alive pattern in this dataset isn’t doing nothing extra, and it’s definitely not grinding 60–70 hours. It’s having a contained, healthy side hustle while keeping total work roughly in the 40–50 hour window.
Financial Pressure Map: Debt, Dependents, and Overload.
Are overloaded side hustlers more likely to have high debt-to-income ratios and more dependents?
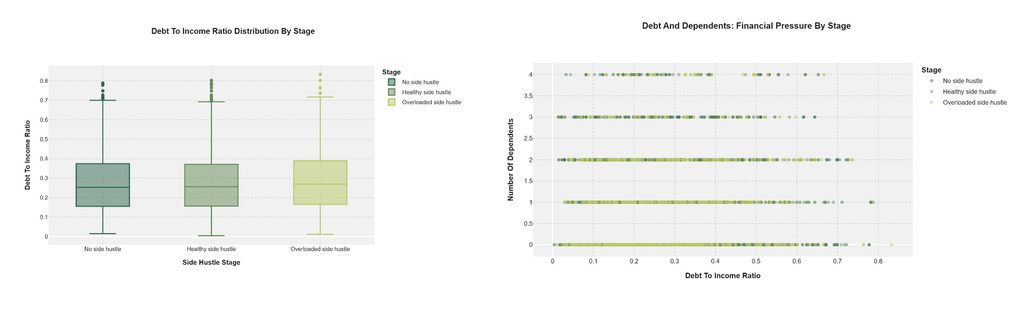
On the debt side, overloaded side hustlers are playing closer to the edge. All three groups sit in a similar middle band most people have a debt-to-income ratio somewhere around 0.2–0.4 , but the overloaded group has the thickest upper tail. Their box stretches higher, and their outliers reach the furthest, up into the 0.7–0.8+ range, meaning some are carrying debt close to their annual income. So it’s not that overloaded hustlers are universally drowning in debt, but they are over-represented in the high-debt zone compared with people with no or healthy side hustles.
When you add dependents to the picture, the story tightens. Across low debt and zero dependents, you see a healthy mix of all three stages. But as you move right into higher debt and up into 2–4 dependents, the dots tilt more yellow more overloaded side hustlers. That suggests a pretty intuitive dynamic: the people most likely to push themselves into overload are often those with both financial pressure (higher debt) and real-world responsibilities (kids or family to support). For them, the side hustle looks less like a creative outlet and more like a financial life raft.
Who Thrives with a Side Hustle?
Which age bands, genders, job types, and relationship statuses are more represented in “Healthy side hustle” versus “Overloaded side hustle”?
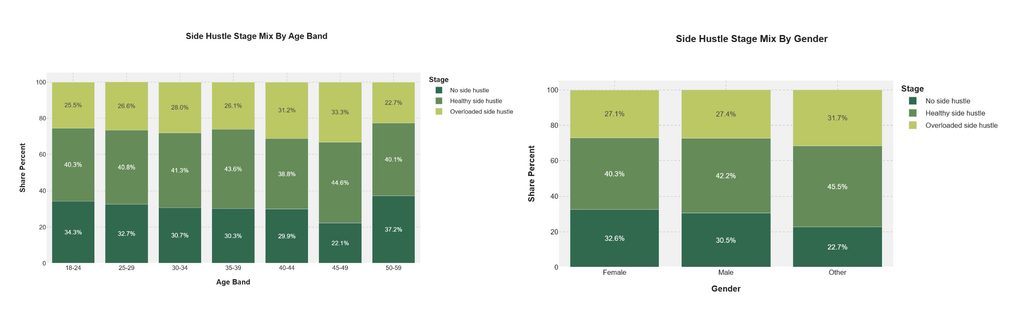
Looking at age, the “healthy side hustle” slice is surprisingly stable across the board: roughly 40–45% of every age band is in the healthy zone. The differences show up at the edges. Younger workers (18–29) are split fairly evenly: about a third have no side hustle, ~40% run a healthy one, and a quarter are already overloaded. In the mid-40s, the healthy share peaks (around 45%) and overload is at its highest too this is the life stage where people are most likely to be hustling hard, not just dabbling. By 50–59, the picture shifts: the “no side hustle” share rises again and overload drops, hinting that many people in this band either step back from side projects or choose not to take them on in the first place.
By gender, the story is more about nuance than big gaps. Women and men look very similar: about 40–42% sit in the healthy zone, a little over 30% have no side hustle, and roughly 27% are overloaded. The “Other” group stands out: they have the highest share of healthy side hustles (45.5%), but also the highest overload share (31.7%) and the smallest “no side hustle” portion. In plain terms, people who don’t identify strictly as male or female are the most likely to be in some kind of hustle either in a well-managed, healthy pattern or pushing into overload while women and men cluster more in the middle, with a similar mix of “no,” “healthy,” and “too much” side work.
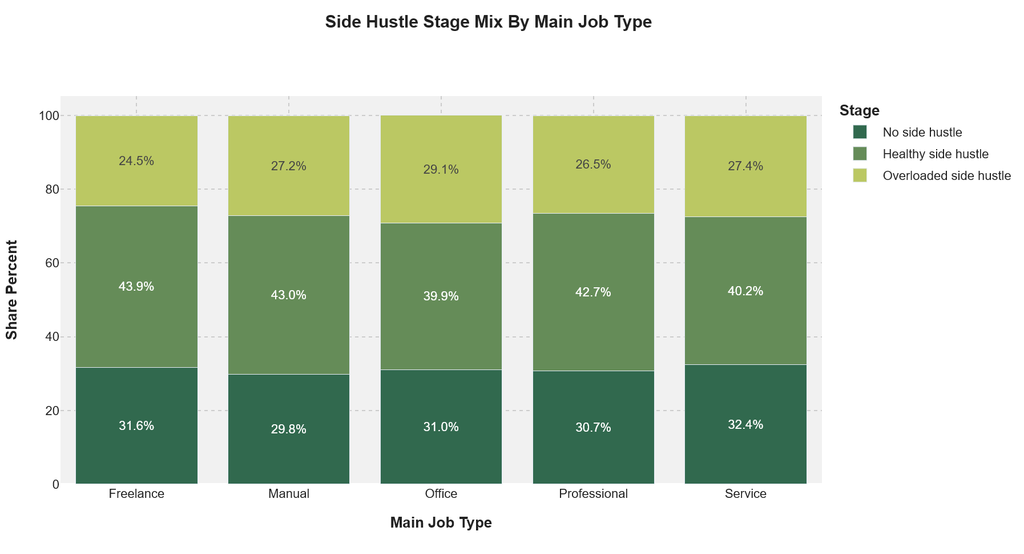
When we look by main job type, the side-hustle mix looks surprisingly consistent but there are a few telling twists. Across all roles, the biggest slice is “healthy side hustle”: around 40–44% of freelancers, manual workers, office staff, professionals, and service workers manage to keep their side projects in a balanced zone. Around 30–32% in each group have no side hustle at all, so the “I just stick to my main job” choice exists everywhere, not just in any one type of work.
The real variation shows up in overload risk. Office workers have the highest share of overloaded side hustles at about 29%, suggesting that stacking corporate work with a second job may be especially prone to tipping into “too much.” Freelancers sit at the other end: they have the highest healthy share (43.9%) and the lowest overload (24.5%), hinting that people who already control their schedule may be better at shaping a sustainable side hustle. Manual, professional, and service workers all sit in the middle plenty of healthy hustles, but roughly one in four drifting into overload.
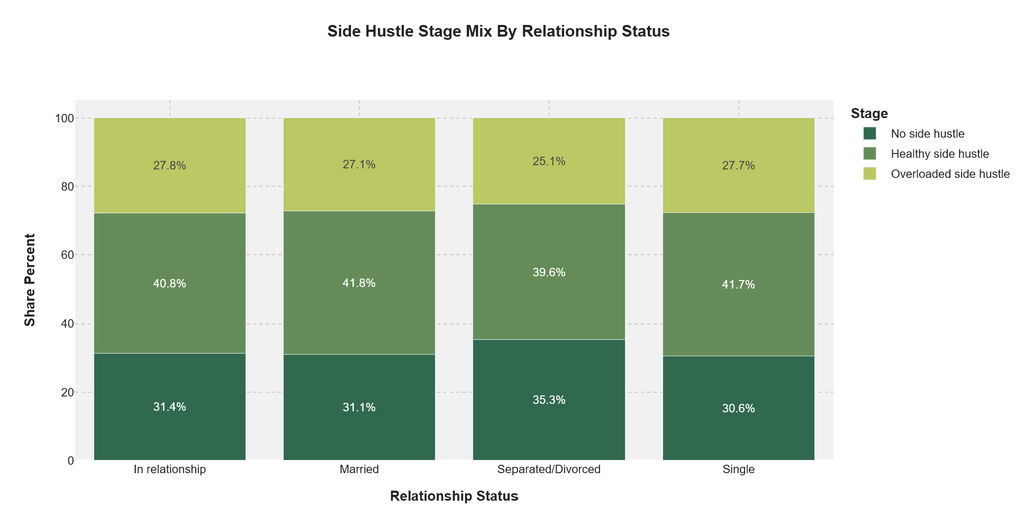
Relationship status barely changes the side-hustle story. Whether people are in a relationship, married, single, or separated/divorced, the biggest slice in every group is still the “healthy side hustle” band at around 40–42%. About 30–35% in each status have no side hustle, and roughly 25–28% are overloaded. The only slight exception is the separated/divorced group, where “no side hustle” is a bit higher and overload a bit lower suggesting some may pull back from extra work during or after a major life change but overall, relationship status doesn’t create dramatic winners or losers in hustle sustainability.
Taken together age, gender, job type, and relationship status the pattern is surprisingly stable: in almost every slice of this dataset, around four in ten people manage to keep their side hustle in a healthy zone, about one in four slide into overload, and the rest opt out of hustling altogether. The real differences show up less in who people are and more in how they work: total hours, debt levels, dependents, and how tightly they push their schedule are what really separate a side hustle that feels empowering from one that slowly grinds them down.
Where Does Hustling Pay Off?
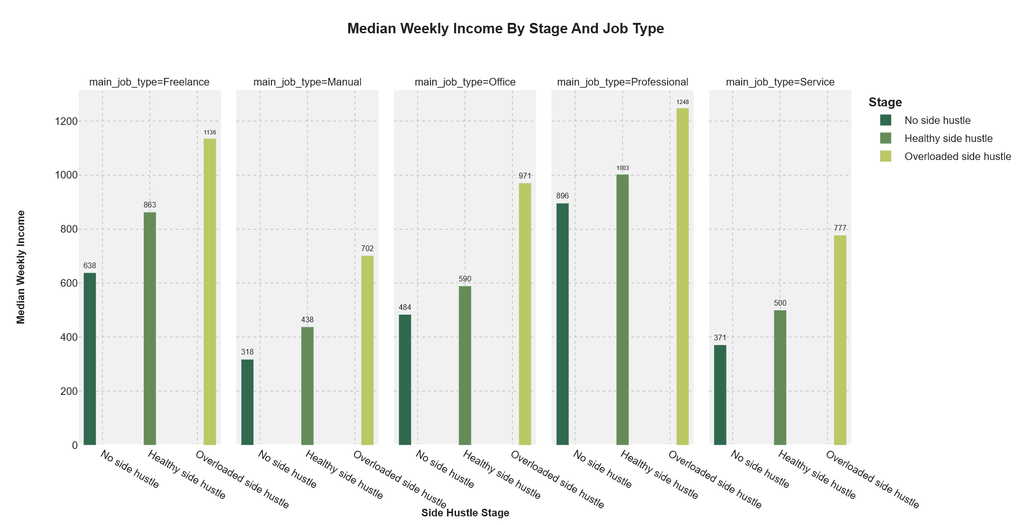
If you zoom in by job type, the income ladder is very consistent: no side hustle at the bottom, healthy in the middle, overloaded at the top but the size of each step changes by role. For freelancers, total median income jumps from about 638 with no side hustle to 863 with a healthy one, and all the way to 1,136 when overloaded. Professionals show an even bigger stack: from 896 (no hustle) to 1,003 (healthy) and up to 1,248 (overloaded). In these roles, the side hustle really can turn into a serious income amplifier.
For manual, office, and service workers, the pattern still holds but the uplift is more modest. Manual workers move from 318 → 438 → 702, office workers from 484 → 590 → 971, and service workers from 371 → 500 → 777 as they step through no/healthy/overloaded.
The takeaway is that hustling “works” in every job type in pure money terms but the biggest financial upside tends to appear in freelance and professional jobs, where skills or rates scale better. That’s exactly where the temptation to push into overload is strongest, and where the trade-off with stress, sleep, and energy matters the most.
What typical patterns of hours, income, energy, and demographics define “no side hustle”, “healthy”, and “overloaded” personas?
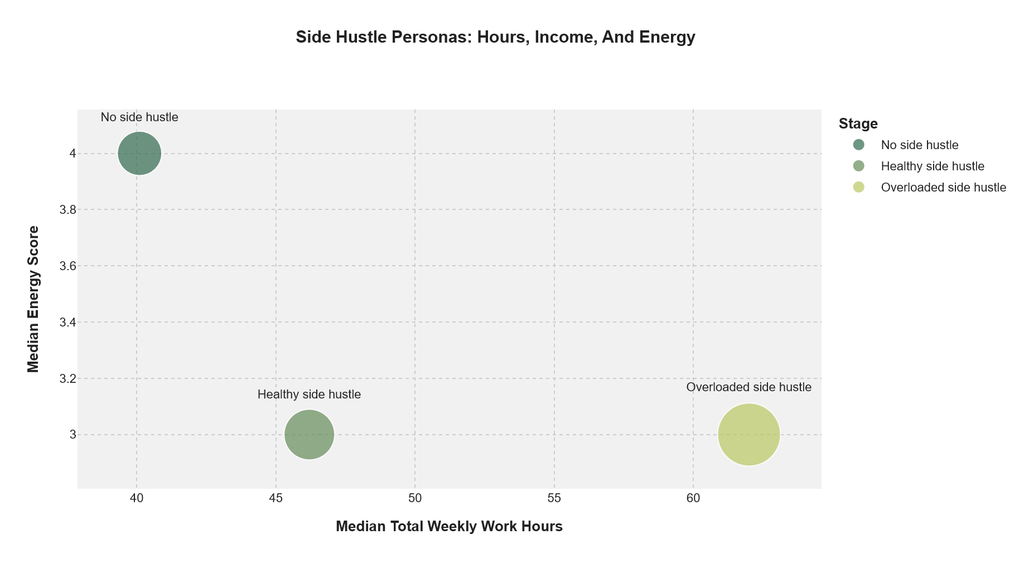
This last chart pulls everything together into three clear personas. On the left, the Comfortable Single-Job Worker sits around 40 hours a week with the highest median energy (~4/5) and the smallest bubble of income. Life is simpler: less money than hustlers, but more fuel in the tank. In the middle is the Healthy Side Hustler: roughly 45–47 total hours, energy down a notch to about 3/5, but with a noticeably bigger bubble meaning a clear income step-up for a still-manageable hit to energy. On the right is the Overloaded Side Hustler: 60+ hours a week, the biggest income bubble of all, but median energy stuck at 3/5, no better than the healthy group despite far more time spent working.
Put in simply it’s become like this:
- The Comfortable Single-Job Worker trades maximum energy and stability for lower earnings.
- The Balanced Builder (Healthy Side Hustle) finds the sweet spot: more money, tolerable hours, and energy that’s dented but not destroyed.
- The Exhausted Grinder (Overloaded) pushes past 60 hours, doubles down on income, but doesn’t get any extra energy or happiness for the sacrifice just a heavier grind.
Let’s put all together.
So when we step back from all the charts, the big picture is surprisingly simple: a side hustle isn’t automatically good or bad it behaves very differently depending on how far you push it. Most people in this dataset sit in the middle, in a healthy side hustle zone: they add roughly one extra workday a week, lift their income by about a third, and still sleep, feel, and function reasonably well. Around them are two clear alternatives: people with no side hustle, who enjoy the highest energy and lowest stress but earn less, and the overloaded crowd, who almost double their income but do it by living in permanent overtime.
The tipping point shows up again and again around 50–55 total work hours per week. Below that range, sleep is stable, stress is manageable, happiness is high, and energy is strongest for people running a contained, healthy hustle. Above it, stress climbs, happiness thins out, and energy slides especially for overloaded workers carrying higher debt and more dependents. Demographics don’t really “protect” anyone: age, gender, relationship status, and job type all show the same basic split, with roughly four in ten people managing a healthy hustle and about one in four drifting into overload. The only real “boosters” are roles like freelance and professional work, where side income scales faster which also makes it easier to overdo it.

So, when does a second job actually help your life, not drain it? In this dataset, the answer is: when it lives in that Balanced Builder pattern about 40–50 total hours, clear but not extreme income uplift, and energy that’s dented but still solid.
Once a side hustle pushes you past 60 hours, driven by debt and obligations more than choice, it stops behaving like a passion project and starts looking like a second full-time job with no extra joy attached. The smart play isn’t “always hustle” or “never hustle,” but designing a side hustle that your energy, sleep, and future self can actually afford.
Author’s Notes:
The analysis presented here is purely for educational and Exploratory Data Analysis purposes. This article is not a scientific study but a data analytics learning project based on synthetic datasets. Any statements should be understood and commented within the context of the samples analyzed, not as universal real conclusions.
Parts of the data analysis and visualization in this article i created by using Phyton, Pandas & NumPy Libraries, Plotly express. And i utilized Chat GPT.5 Codex to streamline and refine the code for better workflow. Hero Images was generated using Gemini: Nano Banana.