


Community, Comfort, Or Cost? What Actually Drives Hostel Stay?
EDA: Looking at beds, activities, digital nomads, and ratings to understand what really moves satisfaction and total spend.
Most hostels like to say the same thing: we are friendly, we are comfortable, and we are affordable. Some guests are loyal even when the beds are basic. Others never come back even after staying in a beautiful space. Somewhere inside the numbers, there is a quiet answer to a simple question: what really makes someone think, “I would stay here again or How my next stay will be”?
In this exploratory article , we are not trying to prove a grand theory or write a scientific paper. We are just going to listen to the data. We will walk through bookings, prices, activities, and reviews from a group of hostels, and see how they play together with one outcome that matters a lot: the decision to return. Along the way, we will check whether community events beat low prices, whether comfort can save a weak location, and where the experience breaks for guests. The goal is simple. By the end, you should feel that you understand hostel loyalty in a more grounded, data shaped way, not from guesswork or slogans.
Before we argue about what makes guests come back, it helps to know the size of the playground: how many people are walking through these doors, how long they stay, and how much they spend while they are here.
This first section sets that stage by turning all stays, nights, and dollars moving through the hostels into a simple heartbeat of the business: guest volume, trip length, and total revenue. Once that baseline is clear, the fun questions become easier to read. Do we feel more like a bed factory or a slow long stay hub, are we mostly making money from rooms or do F&B and activities quietly carry more weight, and which cities and hostels already act as engines for the network by pulling in the most nights and spend. This global snapshot is not the end of the story, it is the starting point that tells us how big the story really is before we zoom into loyalty, experience, and why guests choose to return.
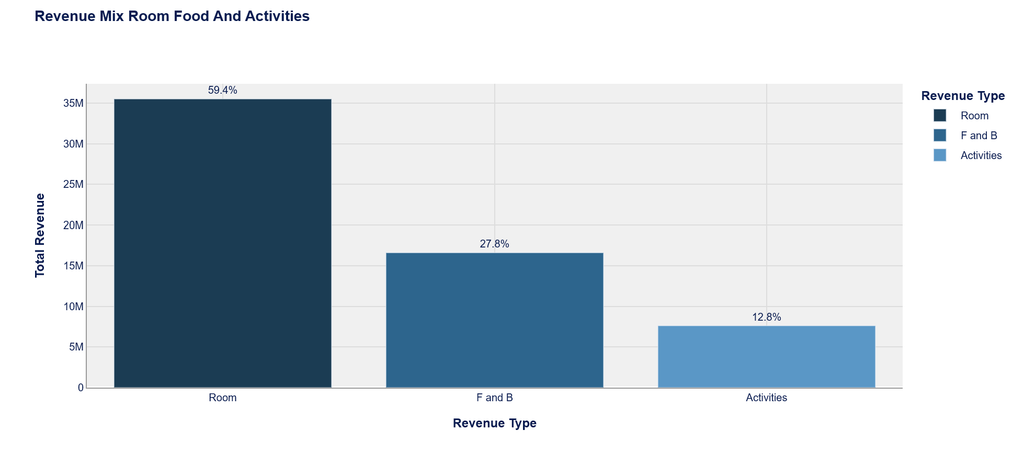
If we zoom in on the money side, this chart basically answers one simple question: where does the cash actually come from in this hostel network. The big dark bar on the left is room revenue, sitting at about 59.4 percent of total spend. In plain words, for every 100 dollars a guest spends with us, around 59 dollars are still coming from beds, so at the core we are still very much a “place to sleep” business.
The middle bar is food and beverage, at 27.8 percent. That is not pocket change. Roughly 28 dollars out of every 100 are spent on breakfast bowls, coffee, cocktails, and whatever people eat between check in and check out. The café and bar are not just nice add-ons, they are a serious second engine. The last bar is activities, at 12.8 percent. It looks small compared to rooms, but it still means around 13 dollars out of every 100 are tied to things like tours, classes, and events.
One easy way to read this chart is like a trio: rooms pay the bills, F&B thickens the wallet, activities color the memory. If we ever talk about “guest experience”, this is the breakdown behind it. Beds keep the lights on, but almost 40 percent of revenue lives outside the room. That matters for loyalty, because guests rarely tell stories about a mattress. They tell stories about the breakfast table, the bar crowd, and the sunset hike they joined. The chart does not measure emotions, but it quietly reminds us that the path to “I want to come back here” probably runs through that non room 40 percent just as much as through the bed itself.
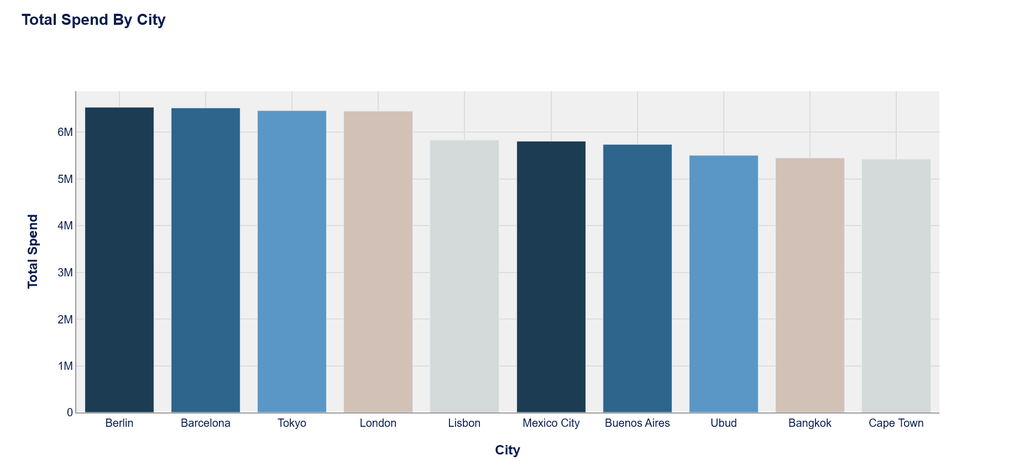
This second chart shows that revenue is not owned by a single superstar city, it is shared across a pretty balanced network. Berlin, Barcelona, Tokyo, and London sit at the top cluster, each pulling in a little over six million in total spend, but they are not miles ahead of the rest. Lisbon, Mexico City, Buenos Aires, Ubud, Bangkok, and Cape Town form a tight band just below them, still generating well over five million each. So instead of one hero and a bunch of side characters, this looks more like an ensemble cast.
That is good news for risk and growth: it means the business is not over dependent on one destination, and it also suggests there are several cities that could be turned into even bigger engines if we decide to lean in with better pricing, more activities, or stronger local marketing.
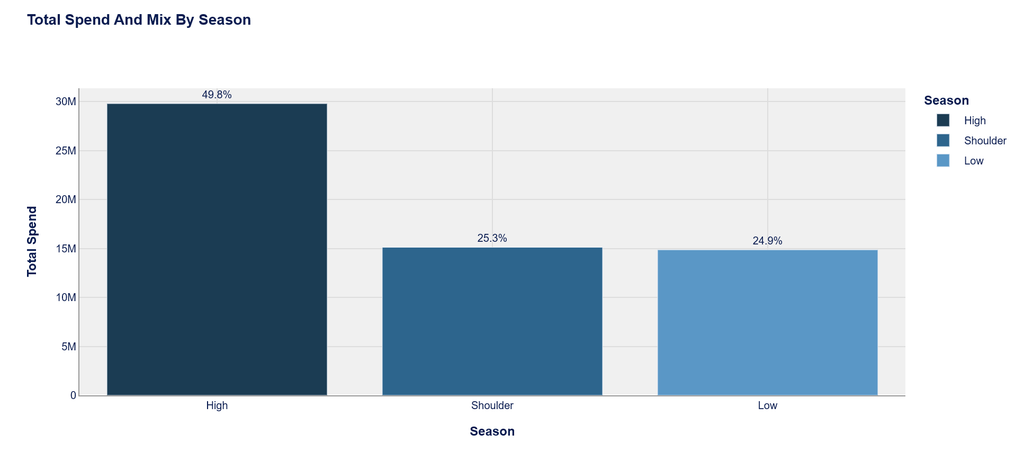
This is basically the seasonality mood of the whole business. High season is still the big star, bringing in just under half of all spend at about 49.8 percent, which fits what we feel on the ground when beds are full, common areas are noisy, and everyone is queuing for tours. What is more interesting is what happens outside that peak. Shoulder and low season are almost twins, each contributing around a quarter of total revenue, 25.3 and 24.9 percent. Put them together and the “quiet months” actually beat high season in total spend. That means the year is not carried by a few crazy busy weeks. It is carried by a long stretch of medium full days where pricing, events, and repeat guests keep the engine running. For loyalty strategy, that is a useful reminder. Winning repeat stays in shoulder and low season is probably just as important as squeezing every last dollar out of the peak.
Let’s trace who exactly like to stay in a hostel ?
If the first section was about the size of the playground, this one is about the people using it. Who actually sleeps in these beds: mostly twenty somethings or a healthy mix of ages, more solo backpackers or couples, more Europeans or guests from everywhere. Are we hosting a lot of first time hostel users, and how many of them are digital nomads carrying their laptops between check in and check out. This is where the data stops being abstract revenue and turns into a real picture of who our community is.
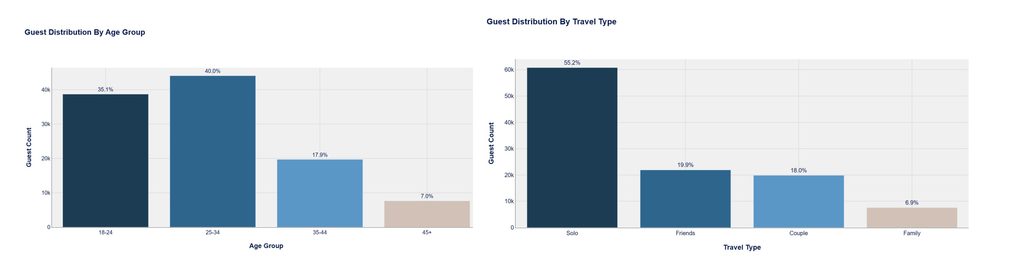
These two charts together draw a very clear picture of who actually shows up at these hostels. On the left, the age distribution is dominated by young adults: 18–24 year olds make up about 35 percent of guests and 25–34 year olds are even bigger at 40 percent, so roughly three out of four guests are under 35. The 35–44 group still shows a healthy 18 percent, while 45+ drops to 7 percent, which means older travelers do come, but they are clearly not the core crowd. On the right, the travel style chart lines up perfectly with that story. A little over 55 percent of guests are traveling solo, almost 20 percent come with friends, 18 percent arrive as couples, and only about 7 percent are families.
Put together, this says “classic modern hostel” in numbers: mostly young solo travelers, sprinkled with small friend groups and couples, with families and older guests as a niche. For operations and marketing, that has a simple implication. The default guest you are designing beds, common areas, events, and digital content for is a solo traveler in their twenties or early thirties who came to meet people, not to hide in their room.
Is that really a digital nomads are the once who love to stay at hostel?
If you listen to Instagram, it can sound like everyone staying in a hostel is a digital nomad living out of Notion boards and airport lounges. These pies tell a calmer story. Across every continent, the slice of digital nomads sits in a very similar band, around 22 percent, while roughly 78 percent are still “regular” travelers on holiday, gap years, or short breaks. Asia, Europe, North America, Oceania, South America all show almost the same pattern, which is kind of the fun part: the nomad wave is real everywhere, but it is not taking over.
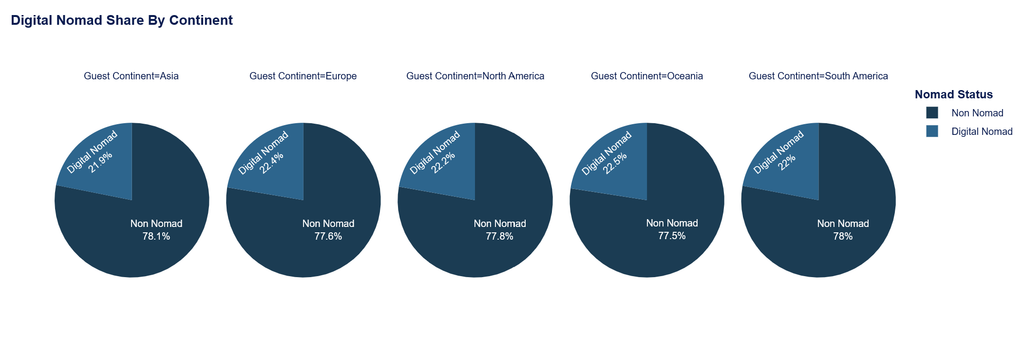
In practical terms, that means the laptop crowd is big enough to deserve good Wi-Fi, work friendly corners, and weekly co working vibes, but the soul of the hostel is still built around classic travelers who close their laptops at most to scan their boarding pass.
Putting all the charts together, the guest mix looks very much like the “classic modern hostel” crowd.
Around three quarters of guests are under 35, with 18–24 and 25–34 as the main blocks, and most of them are solo travelers, followed by small friend groups and couples, with families only a small slice. In other words, the default guest is a solo traveler in their twenties or early thirties who came to meet people. On top of that, about one in five guests across every continent is a digital nomad, while the remaining four are regular travelers. The nomad segment is big enough that solid Wi-Fi, work friendly corners, and community events around remote work really matter, but not so dominant that the hostel should turn into a silent co working space. For design, programming, and marketing, the message is simple: build the house for young solo travelers who want connection first, then tune a thoughtful layer of comfort and infrastructure for the laptop crowd.
How many guests end up staying a week or more?
Before we talk about loyalty or repeat booking, it helps to answer a simpler question: when guests do come, how long do they actually stay. A hostel that lives on one night stopovers feels very different from one where people unpack, settle in, and start calling it “home for the week”. Length of stay shapes everything from occupancy stability and housekeeping pressure to how deep your community vibe can grow, and it also hides a very important group for revenue. The guests who quietly stay a week or more.
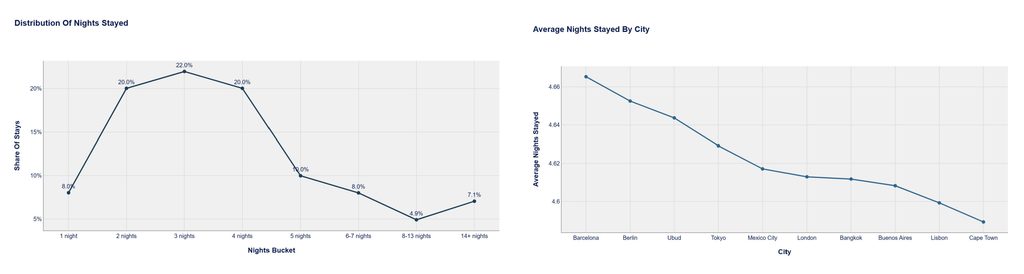
The first chart tells us that the typical stay is short, but not just a hit and run. The peak sits at 3 nights with 22 percent of stays, with 2 and 4 nights close behind at 20 percent each. Put together, about 62 percent of all stays fall in the 2 to 4 night window. So the “average guest” is not a one night transit stop, they are in town for a small trip or a long weekend. At the same time, the tail is meaningful. Around 10 percent stay 5 nights, 8 percent stay 6 to 7 nights, almost 5 percent stay 8 to 13 nights, and just over 7 percent stay 14 nights or more. Add those up and roughly 30 percent of guests are with us for 5 nights or longer. That is a big long stay pocket hiding behind a short stay peak, and it suggests weekly pricing, slow travel activities, and routine friendly amenities are worth the effort.
The second one tells, average nights stayed by city, shows a surprisingly tight pattern. Across Barcelona, Berlin, Ubud, Tokyo, Mexico City, London, Bangkok, Buenos Aires, Lisbon, and Cape Town, the average stay hovers around 4.6 nights. Barcelona sits at the top by a small margin, followed closely by Berlin and Ubud, while Cape Town and Lisbon are a bit shorter, but we are talking about differences of a few tenths of a night, not entire days. In other words, guests behave fairly consistently across the network. Some cities nudge people to stay a little longer, likely due to vibe, cost of living, or how many day trips you can string together, but the overall model is stable. The real variation sits more in the tails. Who manages to convert a casual 3 night visitor into a 10 night regular.
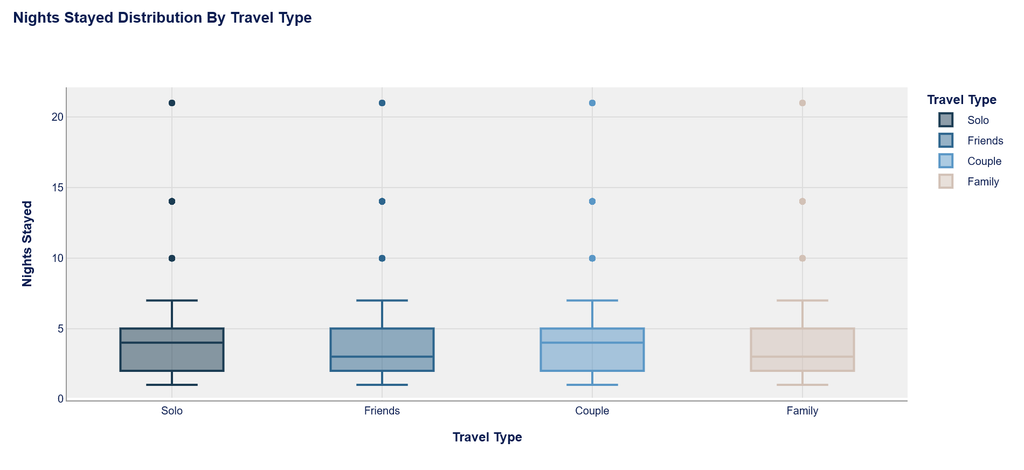
This boxplot is a nice way to see who actually lingers. All four travel types sit in a similar core range, with most stays between 2 and 5 nights, but there are small differences in how “sticky” each group is. Solo travelers and couples tend to stay a touch longer, with medians around 4 nights and a fatter upper range, including those long stay outliers at 10 nights and beyond. Friends and families are a bit more compact around 3 nights, with fewer extreme long stays, which makes sense: it is easier for one person or a couple to extend their trip than for a group or a family that has school and office to get back to.
Taken together, analysis says the hostel network lives on a solid 2–4 night core, but with a meaningful long stay tail where solo guests and couples are the most likely to turn a short visit into a week or more. That long stay pocket is not the majority, but it is large enough to design for: weekly offers, “settle in” perks, and routines that make it easy for these guests to keep adding nights once they are already in house.
But what drive them to stay long in a hostel?
If we already know who our guests are and how long they stay, the next natural question is what they are actually doing with that time. Are they quietly working in corners, or are they signing up for dinners, yoga, and pub crawls that turn strangers into friends. This is where the social side of the dataset starts to speak, and where we can see whether “community” is just a word on the website or something guests really live.
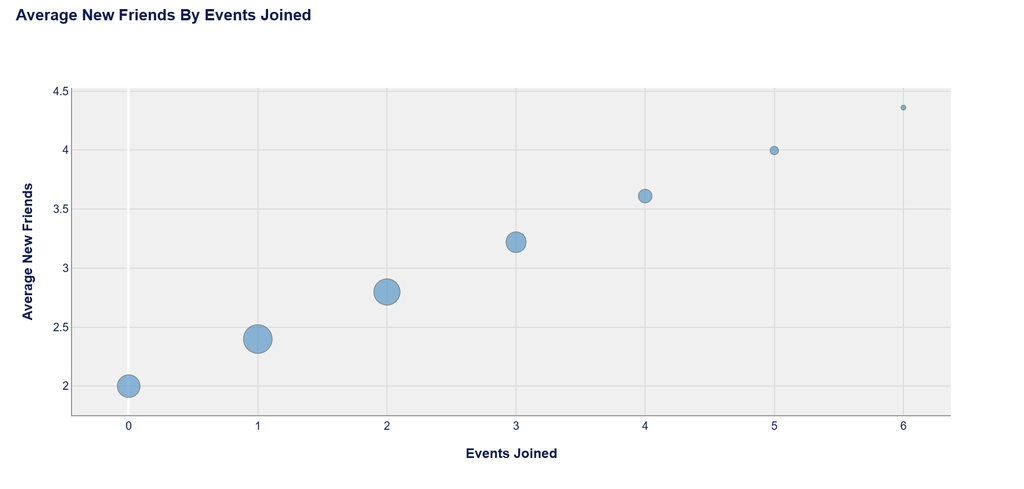
This chart makes the relationship between events and friendship feel almost like a simple rule of thumb. Guests who join zero events still report around 2 new friends on average, which already says a lot about the power of shared dorms, breakfast tables, and random kitchen chats. Once they start joining events, the graph climbs in a very steady way. One event takes them to about 2.4 new friends, two events to roughly 2.8, three events to around 3.2, four to 3.6, five to 4, and six events to about 4.3 new friends on average. So each extra event roughly adds another half friend to their social circle. The bubble sizes tell us that most guests cluster around 1 to 3 events, which means a lot of people are sitting in that sweet spot where a simple schedule of a few well designed activities can almost double their social outcome compared to doing nothing structured at all. From a loyalty perspective, this is a quiet but strong message. If making friends is the emotional currency of a hostel stay, then events are the machine that mints that currency.
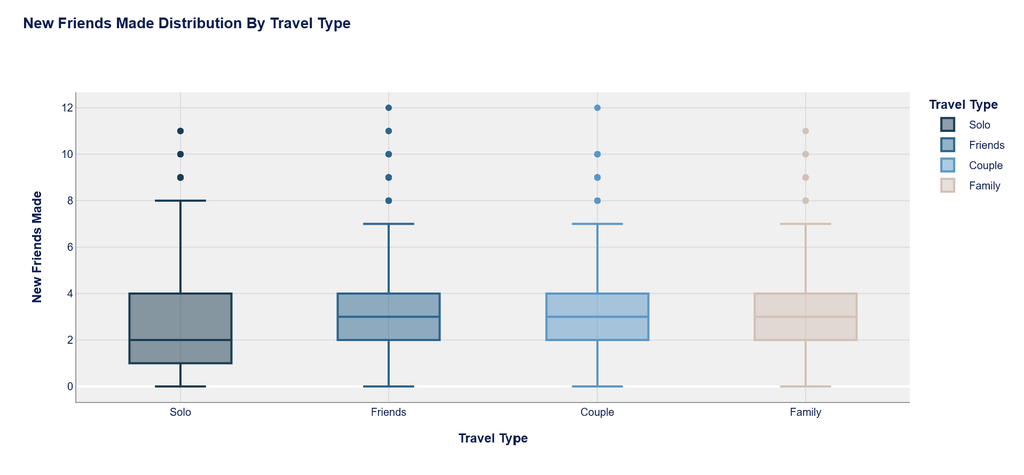
If the last chart showed that events act like a “friend factory”, this one shows who walks out with the biggest social haul. What is nice is that the medians are actually pretty close across all travel types: solo travelers sit a bit lower around 2 new friends, while friends, couples, and families cluster closer to 3. In other words, nobody is completely left out of the social game. Where things really change is in the upper range. Friends and couples have the wildest outliers, with some guests reporting 8, 10, even 12 new friends from a single stay, while solo travelers and families have slightly shorter tails. That feels intuitive. If you arrive with a built in safety net, it is easier to jump into bigger groups, louder nights, and longer pub crawls. The overall message, though, is reassuring for any hostel that sells “community” as a promise. Regardless of whether guests come alone, with friends, as a couple, or with family, most of them still leave with a few new names in their phone, and the ones who lean into events can turn that into a small personal festival.
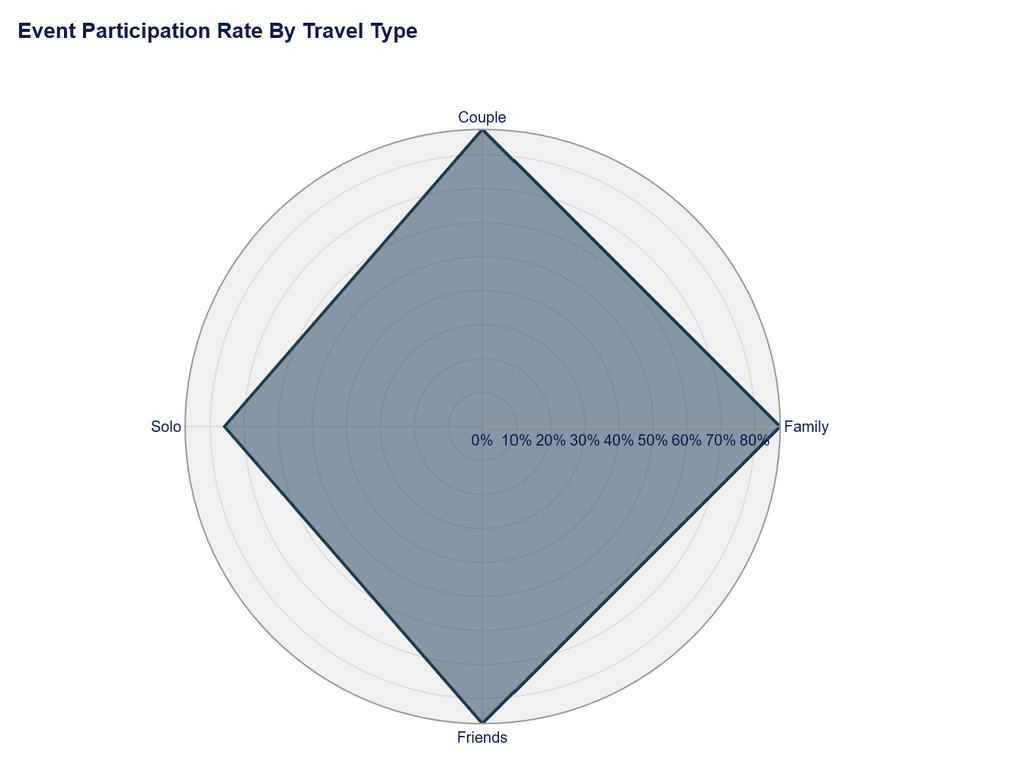
This radar chart closes the loop on the social story by showing how likely each travel type is to join at least one event. The shape is almost a perfect, filled diamond which already tells us something simple and nice: participation is high across the board. Friends sit at the top with the highest join rate, followed very closely by families and couples, while solo travelers are only a little bit behind. So the people who arrive with their own micro group are the most eager to jump into activities, but even solo guests are saying “yes” to events most of the time. That fits what we saw earlier. Everyone, no matter how they travel, leaves with a few new friends, and the ones who step into the event calendar walk away with the biggest social boost.
In short, this analysis says that community is not a niche feature for a small slice of guests. Most people join events, most of them make new friends because of it, and the effect scales with how often they show up. For a hostel brand that wants guests to return, investing in a simple but consistent events program is not just “nice for the vibe”, it is one of the clearest levers to turn a bed for the night into a stay that people talk about and want to repeat.
Are hostel guests truly last-minute bookers?
Hostels have a reputation for being the playground of last minute travelers who book a bed on the bus ride into town. But is that actually true when you look at the numbers instead of the stereotype?
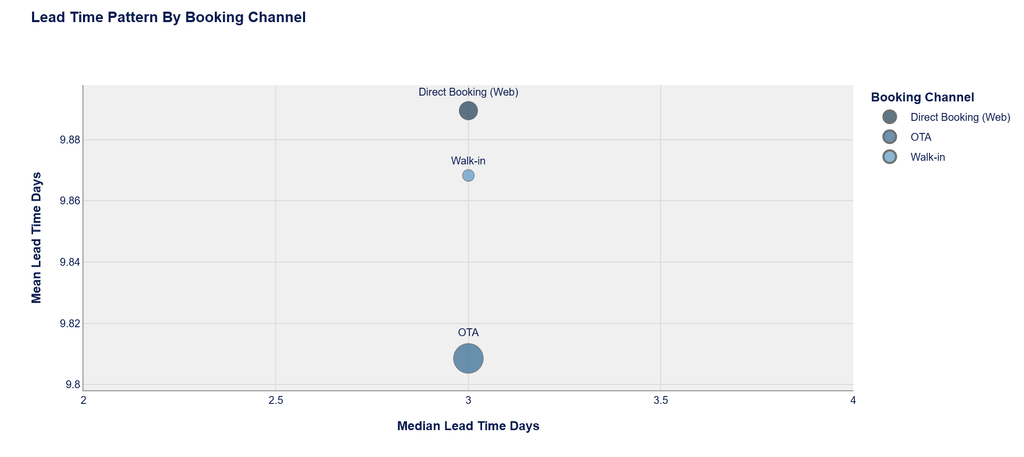
This chart shows lead time by booking channel, and the picture is more balanced than the cliché. Across all three channels, the median guest books about 3 days before arrival. That is short, but not “tonight at 10 pm” short.
The mean lead time for every channel hovers around 9 to 10 days, which tells us there is a long tail of planners who secure their bed one or two weeks out.
OTAs have the largest bubble, so they carry the biggest volume of bookings, with a mean lead time just under 10 days. Direct web bookings sit slightly above that in terms of planning time, which fits the idea of more intentional guests who have actually searched for the brand. Walk ins behave almost the same in terms of lead time once they are recorded in the system, but with a much smaller share of total volume.
So no, hostel guests are not purely last minute bookers. Most of them lock in a bed a few days before, and a meaningful chunk act like classic planners, booking a week or more in advance, especially when they go direct or through OTAs.
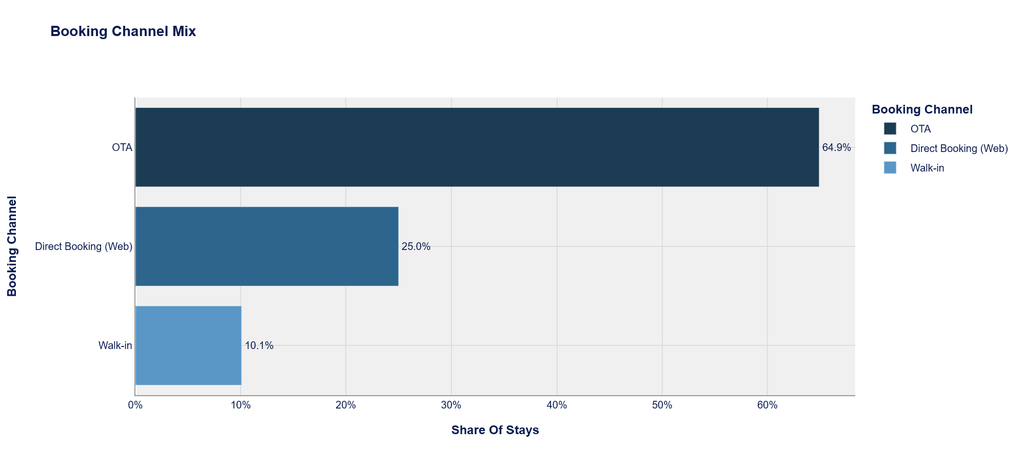
This bar chart shows very clearly who really sends guests to the door. About 64.9 percent of all stays come from OTAs, so they are the main faucet filling the beds. Direct web bookings contribute a solid 25 percent, which is not small at all, and walk ins make up the remaining 10.1 percent. In simple terms, two out of three guests discover or confirm us through third party platforms, one out of four is already choosing to book directly with the brand, and one out of ten still just shows up at the door.
If we tie this back to the lead time chart, analysis says hostel guests are not pure last minute gamblers. Most of them book a few days before arrival, with a long tail of planners who lock things in a week or more ahead, and they mostly do that through OTAs. Direct web is the healthier segment to grow, because those guests plan slightly earlier and come without commission fees, while walk ins remain a small but useful buffer for same day demand. The strategic move is not to kill OTAs, but to use them as a discovery engine and gradually convert repeat or long stay guests into loyal direct bookers with clear perks and an easy website experience.
Who really books 10-bed dorms? More people stay in one room means more social tendency they are.
If you walk through a hostel corridor, every door hides a slightly different personality. Big 10 bed dorm that feels like a festival, tighter 4 and 6 bed rooms where people actually remember each other’s names, and the mysterious privates where you only see the guests at breakfast. This section is about putting numbers behind that feeling. Who is actually choosing which door, and does the “more beds means more social” idea really show up in the data.
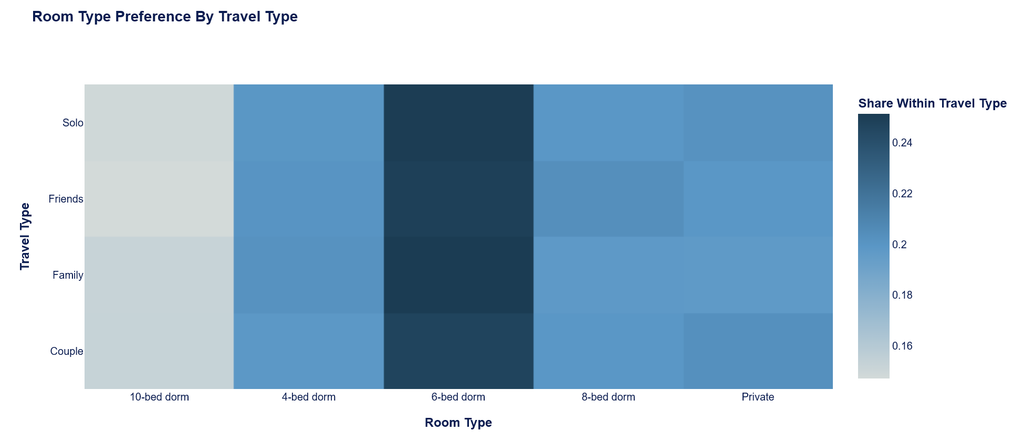
The heatmap gives a very clean answer. Across all travel types, the clear favorite is the 6 bed dorm. Solo travelers, friend groups, couples, even families all lean hardest into that column, which suggests it hits the sweet spot between price, noise level, and chance to meet people. The 10 bed dorm is consistently the lightest cell for every segment, so the ultra packed room is not the mass product here. Guests seem happy to be social, but not at the cost of feeling like a sleepover in a train station. Four and eight bed dorms sit in the middle, popular but not dominant, and privates hold a steady share across all travel types, slightly stronger for couples and families but still not stealing the show.
Put simply, the data says most guests want shared spaces and social energy, just in a mid size format. For planning room mix and pricing, six bed dorms are your workhorse, while 10 beds are more of a niche and privates are a premium side line rather than the new default.
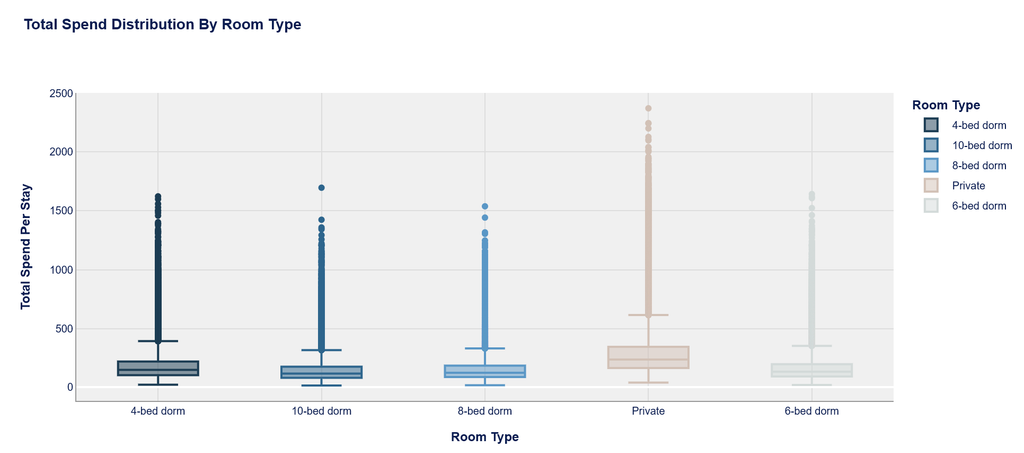
This chart adds the money layer on top of room preference. Private rooms clearly sit in their own league, with the highest median spend per stay and a long tail of big tickets that stretch well above two thousand dollars. That makes sense: you are not just paying for the bed, you are paying for privacy, often for two people, and those guests are also the ones most likely to stay longer or add extras. The dorm types cluster closer together. Four, six, eight, and even ten bed dorms all share a similar core spend range, with medians in the low to mid hundreds and a bunch of outliers where long stays and active guests push the bill up toward fifteen hundred. Among them, six bed dorms again look like the healthy middle ground, with solid spend but without the extreme peaks of privates.
So if we step back, this analysis paints a simple picture. Most guests choose six bed dorms because they balance price and social energy, while privates bring in fewer bookings but a much higher spend per stay. For a hostel brand, that means dorms are still the backbone of community and occupancy, but a small, well priced band of privates can quietly lift revenue and attract older guests, couples, or anyone who loves the vibe but wants their own door at the end of the night.
Do nomads really stay longer and spend more?
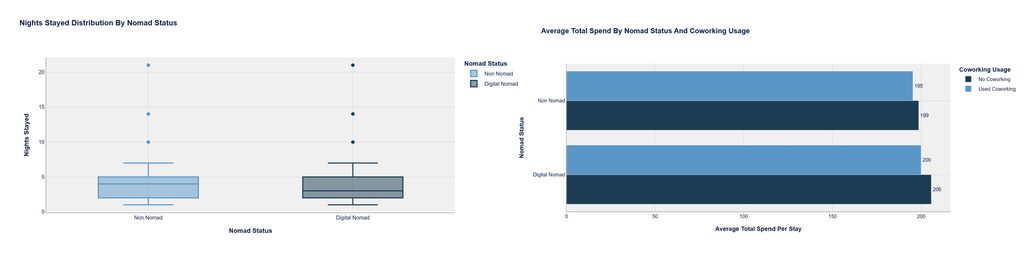
When you put these two charts together, the digital nomad story turns out to be less dramatic and more quietly interesting. On the left, nights stayed look very similar for nomads and non nomads. Both groups cluster around 2 to 5 nights, with a median just over 3 nights and a few outliers stretching past the 10 and even 20 night mark. So the classic mental image that nomads always move in for a month while everyone else just passes through is not really true here. Nomads stay a bit longer on average, but not by a huge margin. On the right, the spend chart shows a small yet consistent pattern. Non nomads spend about 195 dollars if they never touch the coworking area and around 199 if they do. Digital nomads start slightly higher at about 200 dollars without coworking and move up to roughly 206 when they actually use the space. Coworking does not explode the bill, but it nudges total spend up for both groups, especially for nomads.
In short, this says digital nomads are not a different species, they are just slightly heavier users. They stay a little longer, spend a little more, and when they use coworking the revenue per stay rises again. That makes a dedicated, well run coworking corner less of a vanity feature and more of a quiet revenue and loyalty enhancer for a segment that is already happy to give a bit more value back to the hostel.
What Really Drives Overall and Atmosphere Ratings?
If earlier sections showed that events help people make friends, this part answers the next logical question: does that social energy actually show up in the ratings guests leave behind.
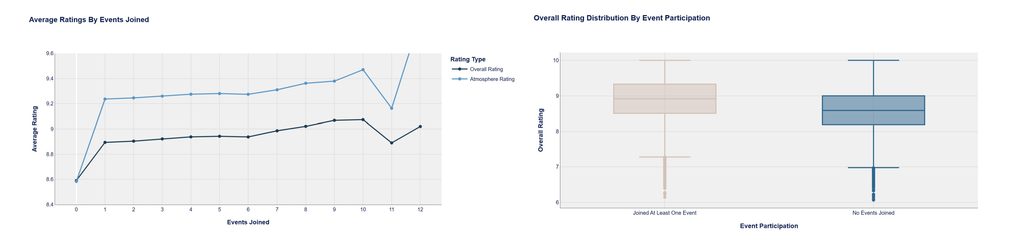
On the left, the line chart tracks average overall and atmosphere ratings as guests join more events. Guests who join zero events already give solid scores, around the mid 8s for both metrics, which means the basic product is working. The moment someone joins even a single event, both lines jump. Atmosphere ratings climb into the low 9s right away and then keep nudging up as guests join 2, 3, 4 events and beyond. Overall ratings follow a similar pattern on a smaller scale. They move from roughly 8.6 at zero events to just above 9 once guests have joined several activities. After about 8 to 10 events, the curve starts to flatten. So the big gain happens early. Going from 0 to 1 or 2 events is where the most emotional lift sits, after that you are polishing an already happy stay.
The boxplot on the right turns that pattern into a simple side by side comparison. Guests who joined at least one event have a higher median overall rating, and their whole box is shifted up compared to those who stayed but never joined anything on the schedule. You can still find low scores in both groups, nothing is perfect, yet the event group has more 9s and 10s and fewer ratings in the 6 to 7 zone. Put together, this says that events are not just “nice for vibes”. They are one of the clearest levers to lift both atmosphere and overall ratings, especially by convincing guests to show up to at least one activity early in their stay.
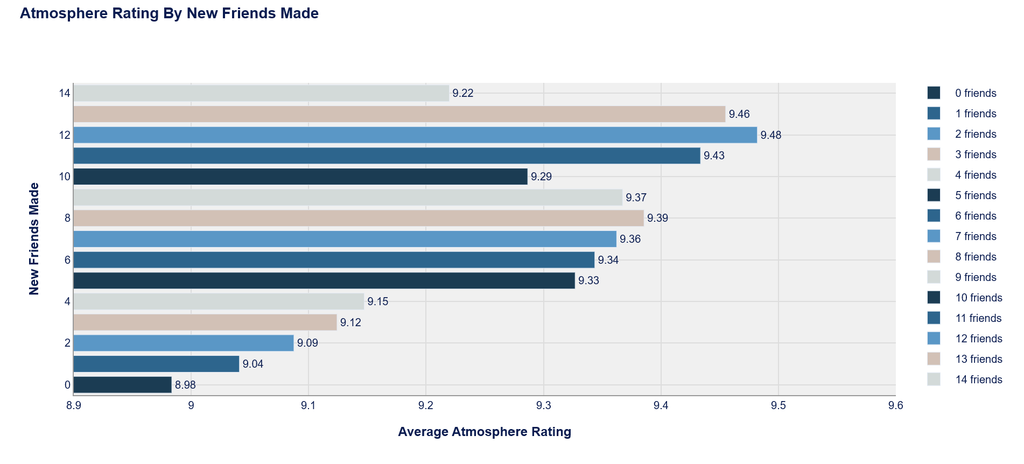
This bar chart is basically the emotional core of the whole dataset translated into numbers. On the left, guests who say they made zero new friends still give a respectable atmosphere rating around 8.98, so the hostels are not failing even when someone keeps to themselves. The moment people start adding names to their contact list, the ratings climb. With 1 or 2 new friends, atmosphere moves into the low 9s, around 9.04 to 9.09. By the time guests report 4 or 5 new friends, we are in the mid 9.1 to 9.3 range. From there, it just keeps drifting upward. Stays that result in 8 to 10 new friends sit around 9.3 to 9.4, and the highest bars belong to guests who made 12 or 13 new friends, with atmosphere scores close to 9.5. The exact numbers wobble a bit at the extreme end, but the story is very simple.
Every extra friend nudges the atmosphere rating up. People do not rate the lighting, the paint, or the check in script. They rate how it felt to be there, and for a hostel that feeling is almost a direct function of how many new faces turned into friends before they checked out, and in some ways friends is not only other guest they met, but staff of the hostels.
Which Destinations Shine the most, for a hostel staycation lifestyle?
If you think of each continent as a “hostel universe”, this chart shows how big each universe is and how happy guests are inside it. On the horizontal axis we have total nights stayed, on the vertical axis the average overall rating, and the bubble size reflects total spend.
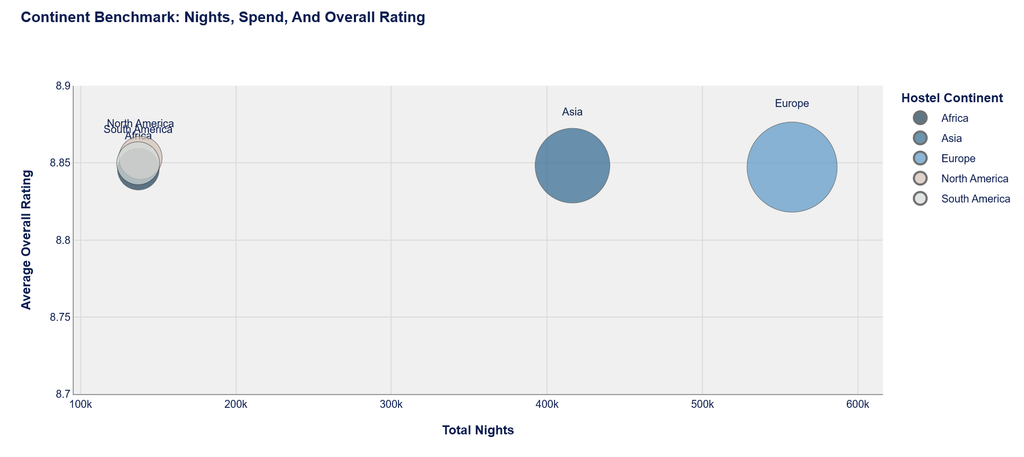
Europe sits furthest to the right with the biggest bubble, which means it hosts the most nights and pulls in the most revenue, while keeping an overall rating around 8.85. Asia is the next large bubble, slightly to the left in nights but sitting at almost the exact same rating. Africa, North America, and South America cluster on the left with fewer total nights and smaller spend, yet their ratings are again very similar, hovering in the same 8.84 to 8.86 band.
So there is no single “winner” here in terms of guest happiness. Europe and Asia are clearly the volume engines of the network, where most hostel nights and dollars land, but the experience score is remarkably consistent across continents. That is the quiet success behind this chart. Whether guests stay in Europe, Asia, or the smaller clusters in Africa and the Americas, they tend to walk away feeling almost equally positive about their stay.
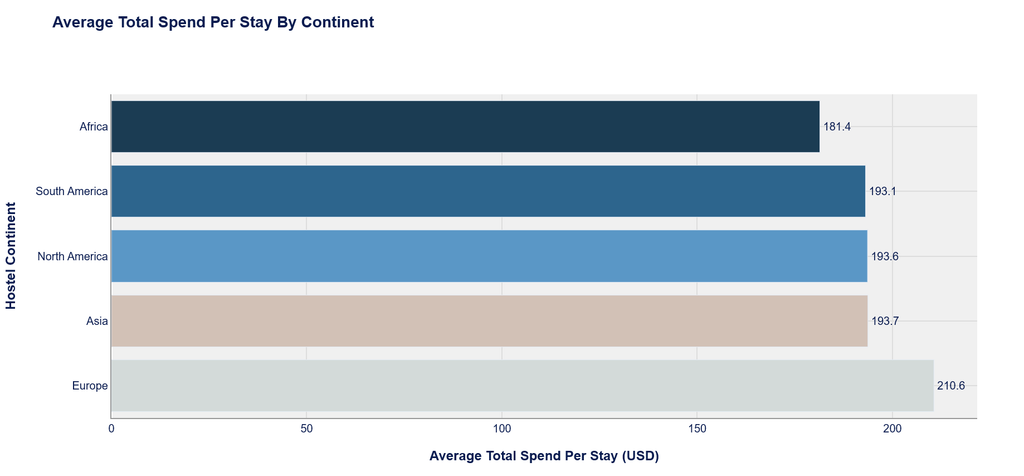
This second chart shows how much an average guest spends per stay in each continent. Europe sits clearly at the top at about 210 dollars per stay, which fits its role as the biggest volume and often higher price point region. Asia, North America, and South America are almost tied in the middle band around 193 dollars, which is surprisingly tight given how different those markets feel on paper. Africa comes in a bit lower at about 181 dollars per stay, suggesting either cheaper room rates, shorter stays, or fewer add-ons like F&B and activities.
Putting both continent charts together, the story is that Europe and Asia are the main engines of the network: they host the most nights, generate the most total revenue, and Europe also leads in spend per stay. Yet guest satisfaction is remarkably flat across the map. Average ratings sit in a narrow band around 8.85 for every continent, even where nights and spend are lower. So the “best” continent is less about happiness and more about scale and ticket size. Guests seem equally happy staying in hostels across Europe, Asia, Africa, and the Americas, but they tend to stay and spend more in Europe and Asia, which makes those regions the natural focus when planning growth, partnerships, and new flagship properties.

Across all the charts, the story keeps pointing to the same thing. Beds and room revenue still pay most of the bills, but almost 40 percent of money is spent on food, drinks, and activities, which are exactly where guests meet people and build memories. The core crowd is young and social: mostly solo travelers and small groups in their 20s and early 30s, staying 2 to 4 nights with a meaningful long stay tail, especially among solos and couples in 6 bed dorms. Guests are not pure last minute gamblers either. Most book a few days ahead through OTAs, a healthy chunk already books direct, and privates and coworking quietly lift spend without breaking the overall hostel feel. Across continents, Europe and Asia are the big engines in nights and revenue, yet average ratings stay surprisingly similar everywhere, which means experience quality is consistent while scale and price level change by region.
On the emotional side, the data is very clear. Events and friendships are the real amplifiers. Joining even one or two activities gives a big jump in atmosphere and overall ratings, and every extra friend made nudges those scores higher again. Digital nomads are not a separate tribe, just slightly heavier users who stay a bit longer, spend a bit more, and respond well to good coworking and routine friendly spaces. Put simply, cost and comfort are the entry ticket. Community is what turns a stay into “I would come back here.” The hostel that wins repeat guests is not just the cheapest or the prettiest. It is the one that combines a fair price, solid beds, the right mix of mid sized dorms and a few privates, steady events, warm common areas, and small upgrades like coworking. When those pieces click together, community, comfort, and cost stop competing with each other and start working as one reason guests choose to return.
Data Source
This dataset was generated and wrangled to mirror real-world hostel booking and guest behavior. It combines common patterns from the hostel industry such as booking channels, room choices, events, spending, and ratings to explore how community, comfort, and cost interact. The goal is to highlight data driven insights in an educational context, not to present operational or market level figures for any specific property or brand.
Author’s Notes:
The analysis presented here is purely for educational and Exploratory Data Analysis purposes. This article is not a scientific study but a data analytics learning project based on synthetic datasets. Any statements should be understood and commented within the context of the samples analyzed, not as universal real conclusions.
Parts of the data analysis and visualization in this article i created by using Phyton, Pandas & NumPy Libraries, Plotly express. And i utilized Chat GPT.5 Codex to streamline and refine the code for better workflow. Hero Images was generated using Gemini: Nano Banana.