
Staying Connected Is Easy, Staying Emotionally Balanced Isn’t.
EDA:How Social Media Addiction Change Brain Behavior.
Ever notice how a five minute scroll somehow turns into half an hour or even more? Social media doesn’t just fill our spare moments anymore, it quietly reshapes them.
The dataset I explored dives into how our online habits intertwine with real-life behavior from how long we stay awake to how focused or anxious we feel afterward. It’s not about blaming the apps or glorifying digital detoxes, but about seeing what the numbers quietly reveal about how modern attention really moves.
Understanding Who’s Behind the Data
Before diving into behavior, it’s worth knowing who’s scrolling. The dataset reflects a nearly perfect gender balance 353 female and 352 male participants showing that digital attachment isn’t a one-sided story. Everyone, regardless of gender, seems to share a similar proximity to their screens.
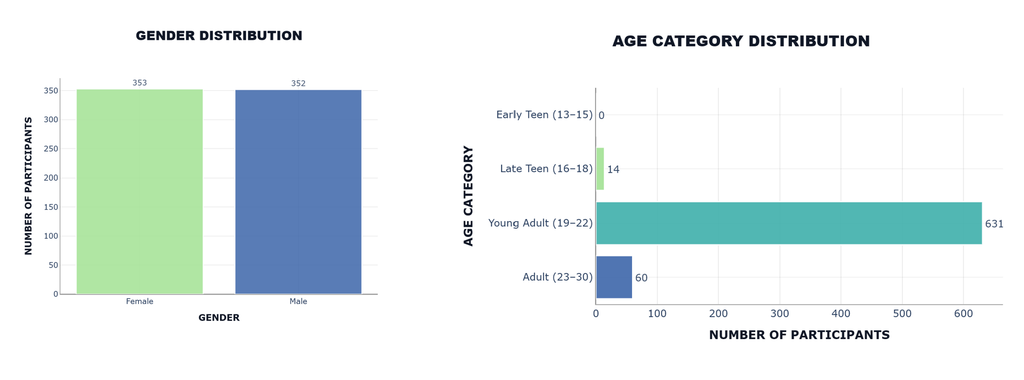
But the real standout comes from the age distribution. A large majority, 631 participants, belong to the young adult range (19–22 years old). This group forms the heart of the digital generation people juggling study, early careers, and social identity, all while living online as much as offline. A smaller segment, about 60 adults aged 23–30, still maintains an active presence, suggesting that social media habits don’t just fade once we leave school. Meanwhile, only 14 late teens (16–18 years) appear in the data, and none from the early-teen group, reminding us that the dataset leans heavily toward individuals already navigating early independence. Meanwhile the early teens age ( 13–15) is absent from the dataset. So let’s focus on the available age range.
Interestingly, after the data I divided into several age categories, it became clear that the young adult and adult groups dominate the sample. This shows that intensive social media habits aren’t just a reflection of youth, but also represent digital behavior patterns that extend into older age groups. In other words, this phenomenon isn’t merely about “teenagers glued to their screens,” but a mirror of how people across different stages of life now interact with the digital world in their own rhythm.
So, when we talk about “addiction” here, it isn’t about teenagers glued to their screens after class it’s about adults still learning how to balance digital noise with real-world focus. The next visual layers might reveal just how deep those habits go.
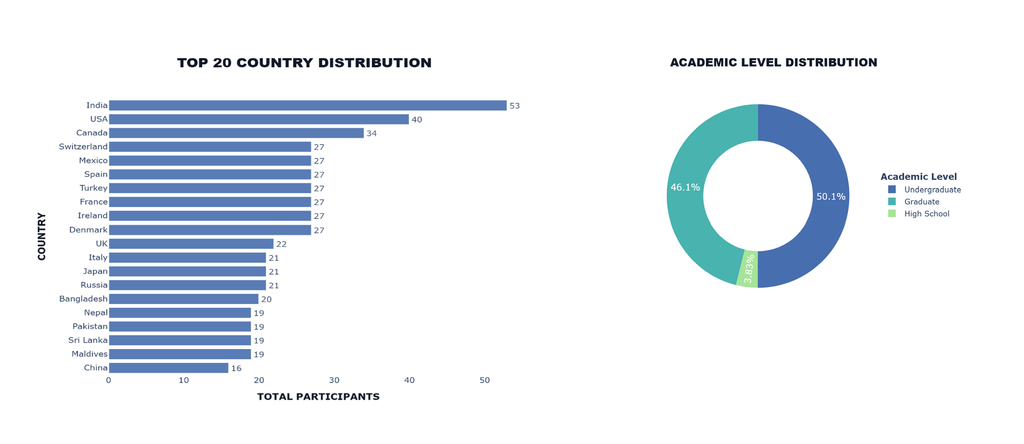
According to the dataset, this data was collected from participant from diverse countries and 3 Level of Education, and here i just show the Top 20 countries where the participants came from and the count of each Education level.
How Long Do They Really Stay Connect to Social Media?
Connection has never been easier, yet our brains pay the quiet cost of constant stimulation. Every scroll, tap, and swipe keeps the mind alert but rarely at rest. When we look at the average daily usage hours, we’re not just measuring how long we stay online; we’re tracing the subtle patterns of digital dependence (especially Social media platform) forming beneath it.
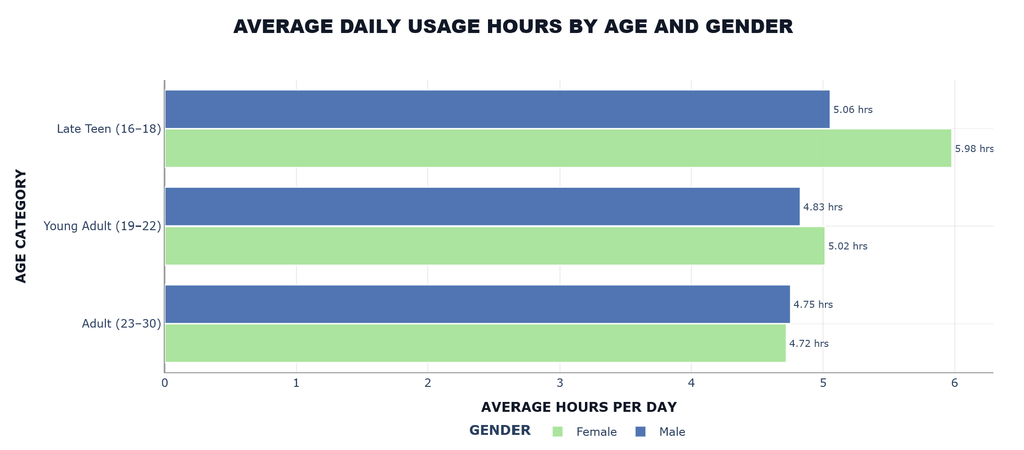
When the numbers are laid out, the hours tell a quiet story. Across all age groups, people spend roughly five hours a day scrolling, tapping, and reacting almost a third of their waking time. Among the late teens (16–18), the usage stretches the longest, especially for females, who average 5.98 hours a day compared to 5.06 hours for males. The difference might look small, but it hints at how online engagement could be more emotionally or socially anchored among young women.
As we move into the young adult (19–22) and adult (23–30) groups, screen time slightly declines to around 4.7–5.0 hours daily for both genders. That steadiness across age suggests something deeper social media isn’t just a passing habit of youth, but a sustained behavioral rhythm that follows them into adulthood.
In my view, they aren’t just connected; they’re constantly connected. And when that connection turns into an unbroken routine, the brain may start to adapt sometimes blurring the line between real emotional fulfillment and digital validation. If left unchecked, this constant stimulation could evolve into an emotional weight, shaping interactions both positively and negatively. Still, that perspective is only an early assumption. To see whether the data truly supports this emotional shift, we’ll need to look deeper into the next layers of their online behavior.
But First Let’s Check Where Do They Spend Their Digital Hours the Most?
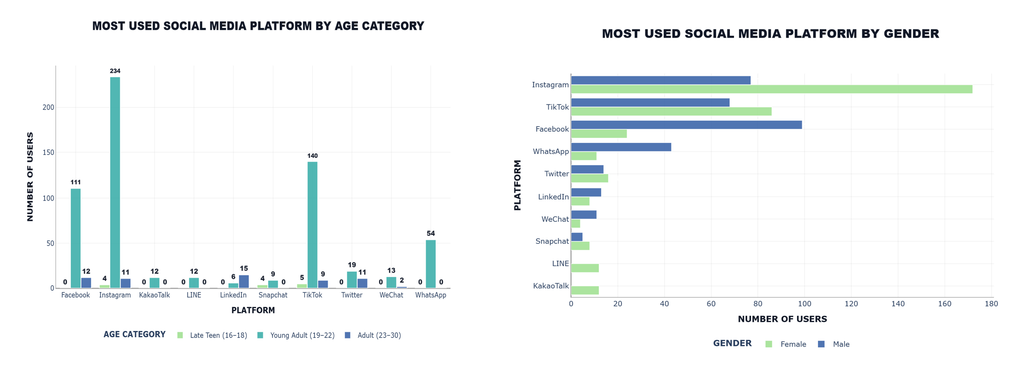
It’s more interesting to know when it comes to where they channel all those hours, the data paints a familiar yet fascinating picture. According to the dataset, Instagram clearly dominates across nearly every age group, especially among young adults (19–22) with 234 users far ahead of any other platform. It’s followed by TikTok with around 140 users, showing how short-form content now rivals photo sharing as a main source of connection and entertainment.
Meanwhile, Facebook still holds a modest but steady user base, mostly among the adult group (23–30). This suggests that older participants might still rely on traditional platforms to maintain social circles or professional networks, while the younger demographic gravitates toward faster, more expressive spaces. WhatsApp appears as a practical layer not for content, but for communication with 54 active users, reinforcing that even in social media behavior, messaging apps remain essential.
Looking through the gender lens, the trend becomes even clearer. Female participants lean more toward Instagram and TikTok, emphasizing visual and social interaction, while male users show slightly higher numbers in Facebook and WhatsApp, platforms that are more utility and network-oriented. So for the media social itself ( let’s skip the messenger app), there are top 3 most used : Instagram, Facebook and TikTok.
Overall, these differences speak a deeper behavioral divide: women tend to use social media for connection and expression, men slightly more for communication and information. Yet both are equally entangled in the same digital ecosystem just in different corners of it.
How Does Their Daily Activity Composition Change When Technology Like Social Media Enters Their Life?
Social media isn’t just a pastime anymore it’s a quiet companion that fills every pause between work, study, and rest. Nowadays some of us even use it as essential part of our life. The next part of the dataset explores how daily activity shifts when digital engagement becomes part of the routine. From time spent relaxing to hours meant for focus or social interaction, the numbers reveal how technology has subtly rewritten the structure of their days. It’s less about how often they go online, and more about what gets displaced when they do.
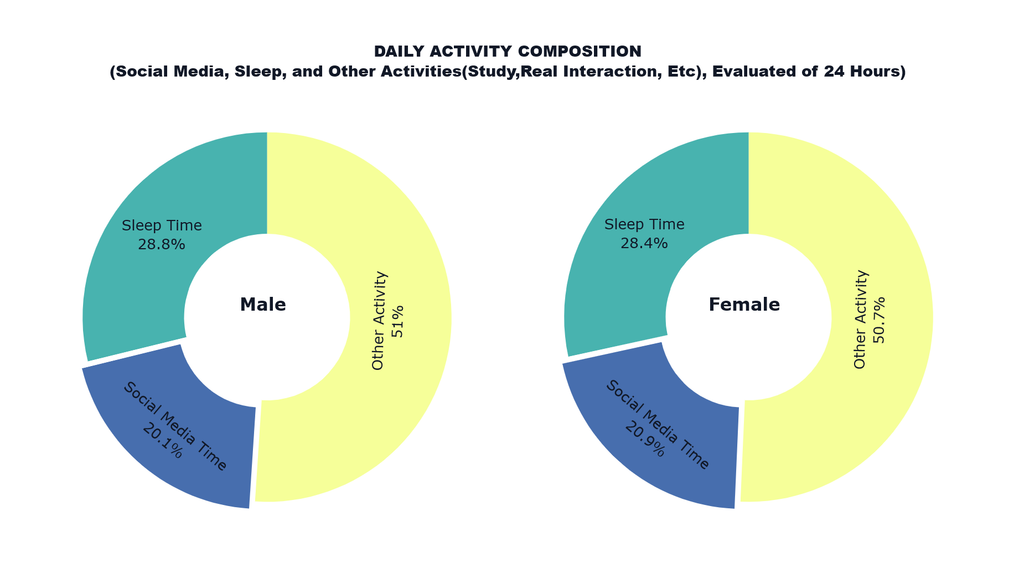
If we imagine a day as twenty-four equal slices, social media quietly claims one-fifth of it roughly 4.8 hours every single day. According to the dataset, both genders spend about 20% of their daily time engaging with digital platforms, an amount that sits uncomfortably close to the time they dedicate to sleep, which averages 6.8 to 7 hours (around 28% of the day). That means for every hour they rest their eyes, they spend almost forty minutes stimulating their brains through screens.
For males, this translates to around 4.8 hours of social media use, 6.9 hours of sleep, and about 12.3 hours left for all other activities studying, working, relaxing, and socializing. Females show an almost identical rhythm, spending about 5 hours online, 6.8 hours asleep, and 12.2 hours balancing everything else.
What stands out isn’t the difference between genders, but how consistent the pattern is. Technology now sits side by side with fundamental human needs like sleep and real-world interaction. It doesn’t just fill spare time it reshapes how time is distributed in a day. And when nearly five of those hours are mentally active but physically passive, it’s fair to ask how much true emotional recovery still happens offline.
If social media were taken out of the equation, those nearly five hours a day could easily shift toward something far more restorative genuine human interaction, focused learning, or simply being present in quiet moments. Without the constant pull of notifications, the balance between digital and real life might lean toward deeper conversations, longer attention spans, and more meaningful rest. Yet it’s also fair to note that social media isn’t entirely a distraction; for some, it has evolved into a space of creativity and opportunity. Becoming a content creator, running an online business, or building a personal brand can transform screen time into productive hours that generate income or ideas. In that sense, the impact of social media depends less on the platform itself, and more on the intention behind the scroll.
Does Social Media Interaction Affect Their Academic Performance?
Most participants in the dataset are undergraduate and graduate university students, and many of them already fall into the young adult and adult categories an age where focus, discipline, and career preparation start to define daily life. With social media occupying several hours each day, it’s worth asking: does this constant interaction online quietly shape or perhaps disrupt their academic performance?
But before that to make it easier to dive in, i have divided the user according to their usage hours into 3 classes: Light User = < 3 jam, Moderate User = 3–6 jam, Heavy User = > 6 jam, and will distributed in “Yes” and “No” responses, and here’s what we’ve got:

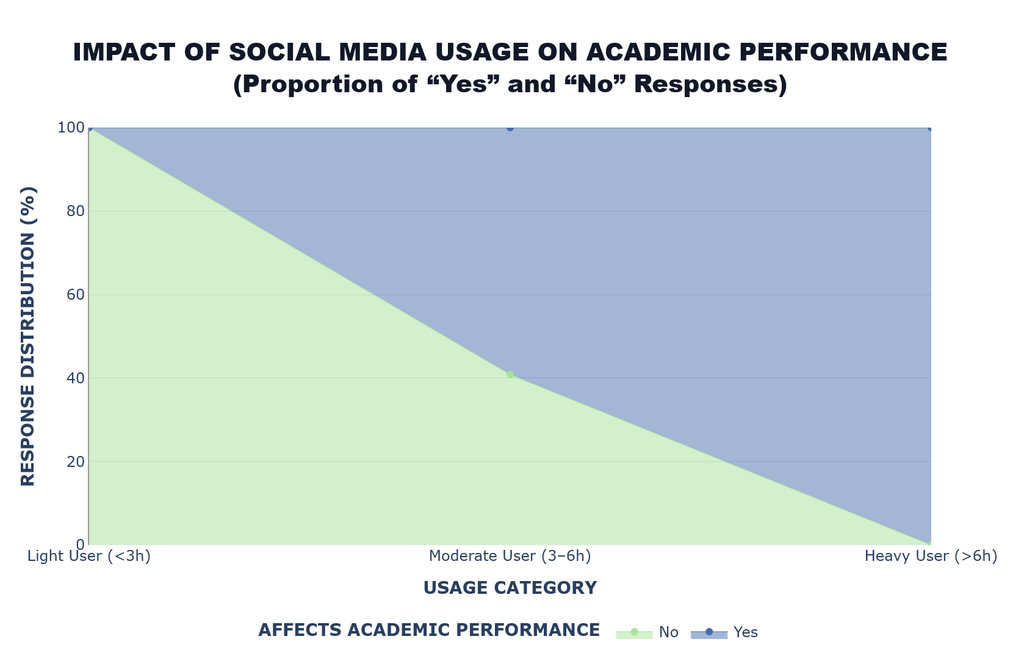
This tells a story that feels both predictable and alarming. Among light users those who spend less than three hours a day on social media 100% reported no negative impact on their academic performance. They manage to stay connected without crossing the line where focus begins to fade.
But things change quickly once daily use rises. In the moderate user group (three to six hours a day), nearly 60% admitted that social media had already begun to affect their academic life, and it might be kind of distractions, procrastination, and fragmented attention seem to quietly take over, even when total screen time still looks “normal.”
By the time usage passes six hours a day, the picture becomes one-sided. Every single heavy user (100%) reported that social media interferes with their studies. At that level, digital engagement no longer feels like a side activity it becomes a parallel world competing with academic focus and mental rest.
This doesn’t mean social media directly causes poor performance. But it suggests that when daily engagement crosses a certain threshold, it starts to replace cognitive energy that should be spent on deep learning and reflection. In other words, the brain stays busy, but not productive.
How Does This Affect Their Mental Health?
To understand the emotional side of social media usage, I focused on three key indicators. First, the distribution of Mental Health Scores (rated on a scale of 1–10, where 10 represents the best state of well-being). Second, the relationship between average daily usage, addiction score, and mental health score, which helps reveal how screen time correlates with emotional stability. And third, a comparison of average mental health scores by gender, to see whether emotional balance differs between male and female participants regardless of their age category.
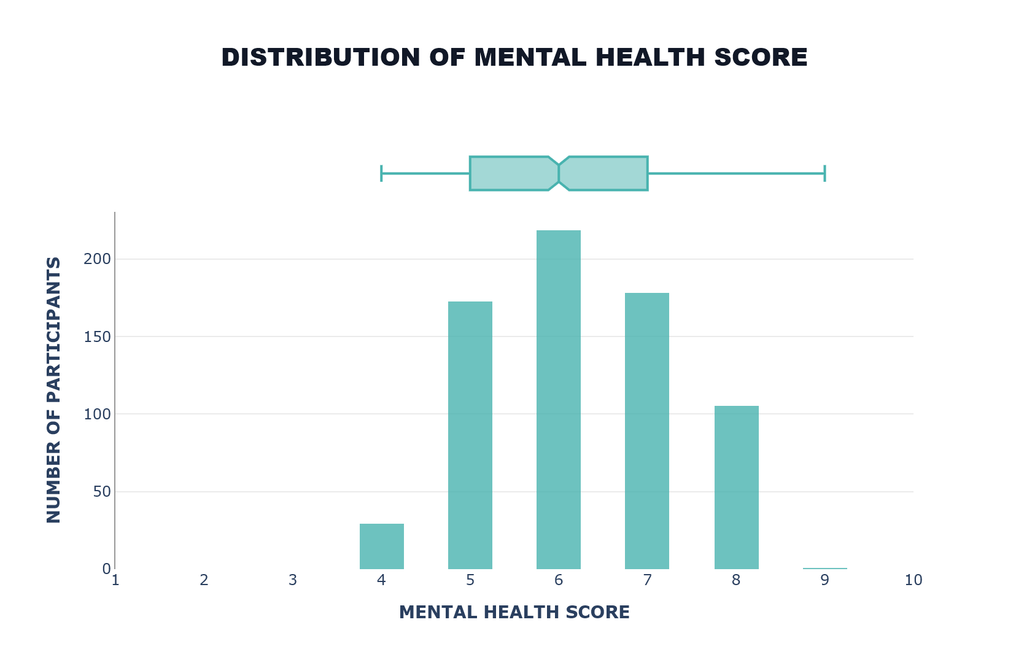
Looking at the distribution of mental health scores gives the first hint of the emotional landscape behind the screens. Most participants fall within the moderate range, with scores clustering between 5 and 7 on a scale of 1 to 10. The peak appears around 6, suggesting that while many maintain a fair level of emotional stability, very few report being in their optimal mental state.
Only a small number reach scores above 8, and just a handful drop to 4 or below, meaning extreme conditions either very positive or very negative are relatively rare in this dataset. What this tells us is that the majority are living in a middle zone: not mentally distressed, but not entirely balanced either.
This moderate distribution mirrors a common pattern of digital era well-being where constant connectivity doesn’t necessarily break mental health, but keeps it in a subtle state of tension. The mind stays active, but rarely rests.
The Link Between Social Media Daily Usage, Addiction, and Mental Health:
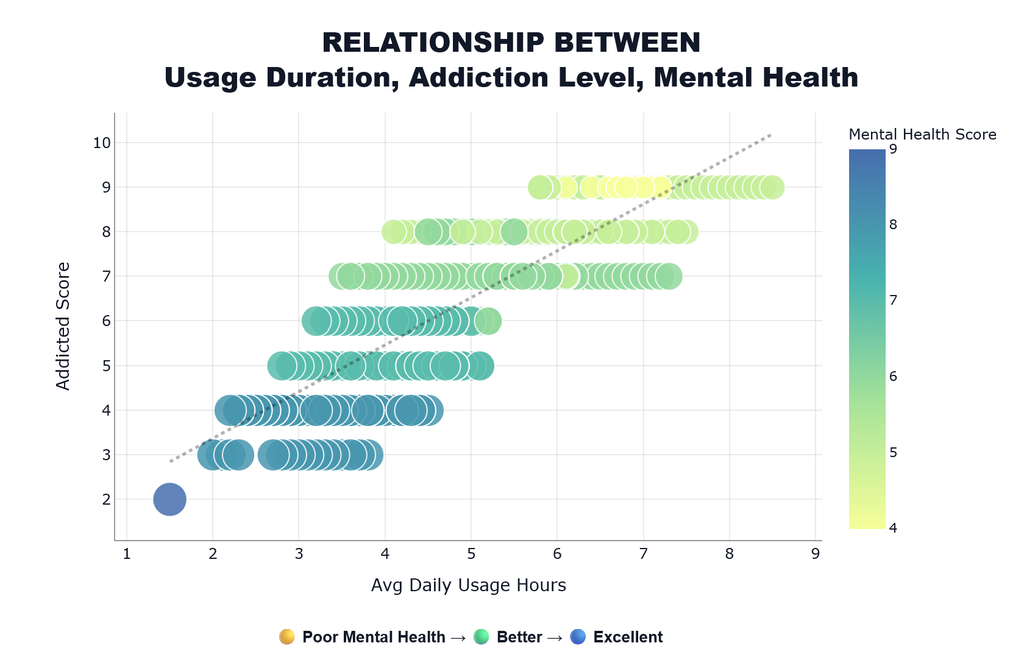
This scatter connects three dimensions how long they use social media, how addicted they feel, and how healthy their minds are. The regression line running through the plot tells a familiar but concerning story: as average daily usage increases, addiction scores rise almost linearly, while mental health scores tend to shift downward in color intensity from cooler blues (better well-being) to warmer tones (lower scores).
At the lighter end of usage, around 2–3 hours a day, most participants show lower addiction levels (scores of 3–4) and relatively stable mental health. But once screen time extends beyond 5 hours daily, addiction scores rise above 7, and mental health begins to fluctuate noticeably. The color transition from blue to green to yellow signals that emotional balance gradually erodes as usage becomes habitual rather than intentional.
This correlation doesn’t suggest that social media directly harms mental health, but rather reflects what the dataset quietly shows that higher Social media engagement often coexists with lower self-regulation and emotional steadiness. As screen time expands, mental health scores tend to shift slightly downward, revealing how prolonged exposure may challenge emotional balance over time.
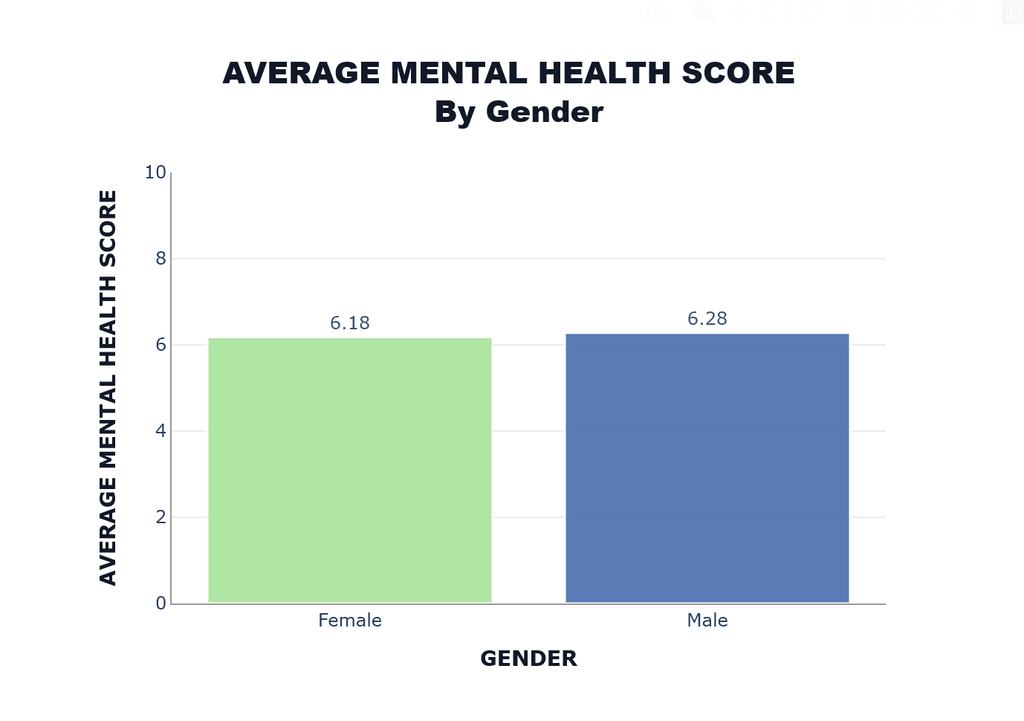
When comparing genders, the difference in mental stability appears minimal but telling. Male participants record a slightly higher average mental health score (6.28) compared to females (6.18). If we place this on a scale of 1 to 10, where 10 represents the strongest emotional stability, both genders fall within a moderate zone balanced, but not fully at ease. This suggests that while men in this dataset may show a marginally steadier emotional state after integrating social media into their daily lives, the gap is too small to imply stronger resilience. Instead, it highlights how emotional responses to online engagement differ subtly: women might internalize digital experiences more deeply, while men tend to externalize them. Yet both move within the same psychological bandwidth constantly balancing connection and calm in an always-on world.
Does Social Media Reflect Anything On Personal Relationship Like Create Conflicts Over It?
Emotions and technology often mix in unpredictable ways, especially when relationships come into play. The next part of the dataset compares relationship status whether participants are single, in a relationship, or in a complicated situation with their level of social media addiction and the frequency of conflicts triggered by online interactions. It’s an interesting angle, because social media isn’t just about scrolling or sharing; it’s also about how people connect, communicate, and sometimes misunderstand each other in a digital space that never really turns off.
he dataset shows that most participants identify as single (384 people), followed by those in a relationship (289), while a smaller group only 32 participants describe their status as complicated. This distribution gives useful context before analyzing how social media interacts with emotional dynamics. Being single might mean more open engagement and social exploration online, while those in relationships or complicated situations may experience more emotionally driven interactions. Together, these categories set the stage for understanding whether social media serves as a bridge for connection or a trigger for conflict.
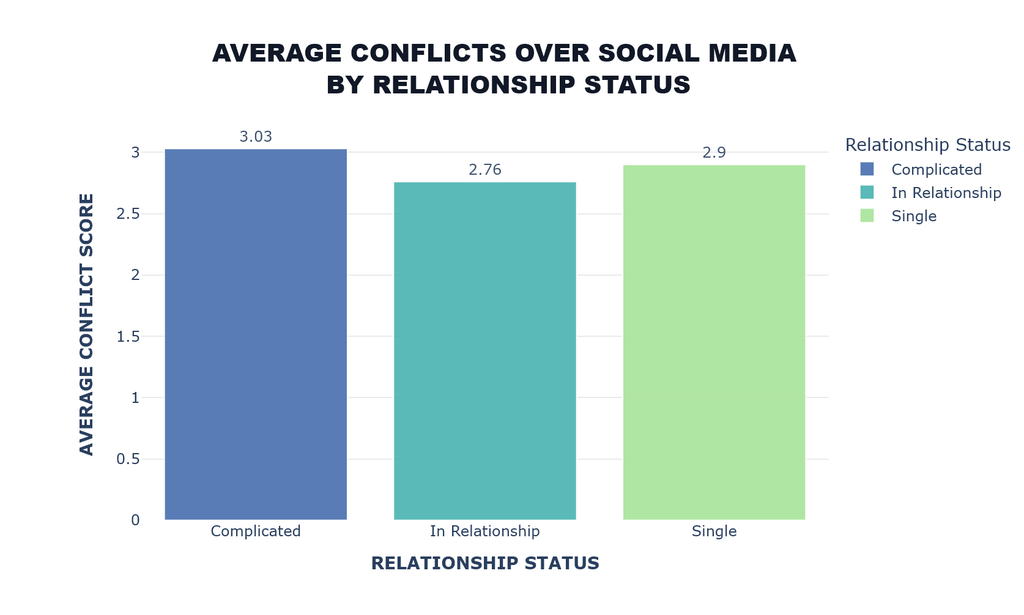
The data shows that social media does seem to echo people’s emotional realities. Those who describe their relationship as complicated report the highest average conflict score (3.03), suggesting that online interactions often mirror or even amplify existing tensions. Meanwhile, participants in a relationship record a slightly lower score of 2.76, which may reflect typical disagreements over communication, privacy, or digital boundaries small frictions that come with shared online spaces.
Surprisingly, even those who are single report a comparable level of conflict (2.9), indicating that emotional friction on social media isn’t limited to romantic contexts. For many, it may arise from online validation, comparisons, or social pressure.
Overall, the numbers suggest that while relationship status shapes how people experience social media, conflict remains a shared byproduct of connection one that reflects how personal emotions and digital spaces continuously overlap.
Addiction Level vs Social Media Conflicts by Those Relationship Status.
But is that really correlated?
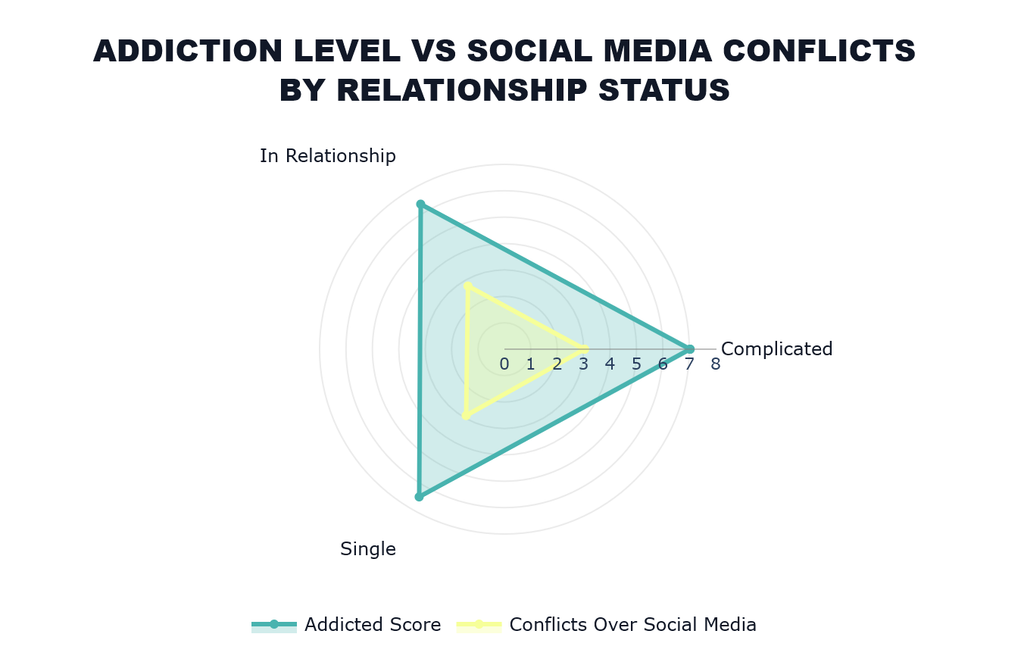
The answer is “Yes’ according to the data, radar chart helps connect the dots between emotional context and digital behavior.
The radar reveals that love in the digital era has two faces, the more connected people are, the more fragile those connections can become. Those in a relationship appear to be the most active on social media, yet they also experience the highest rate of conflict. For them, the online world often becomes an extension of emotional exchange sometimes warm, sometimes volatile.
Meanwhile, those in complicated relationships show unstable digital patterns, mirroring the uncertainty they feel offline, as complicated as their relationship status. In contrast, single participants seem the most at ease, treating social media simply as a space for interaction rather than an arena of emotional struggle. Together, these patterns remind us that technology may connect hearts faster than ever, but it also tests how strong those bonds truly are.
What Happens When We Put All the Main KPIs Together?
When all four variables daily usage hours, sleep duration, mental health, and addiction score are analyzed side by side, a clear behavioral pattern emerges. The data shows a strong positive correlation (0.83) between daily usage and addiction level, confirming that the more time participants spend online, the more they develop a dependency on it. However, that increase comes at a cost: both sleep duration (-0.79) and mental health (-0.80) show negative correlations with usage, meaning that longer online time tends to coincide with shorter rest and lower emotional well-being.
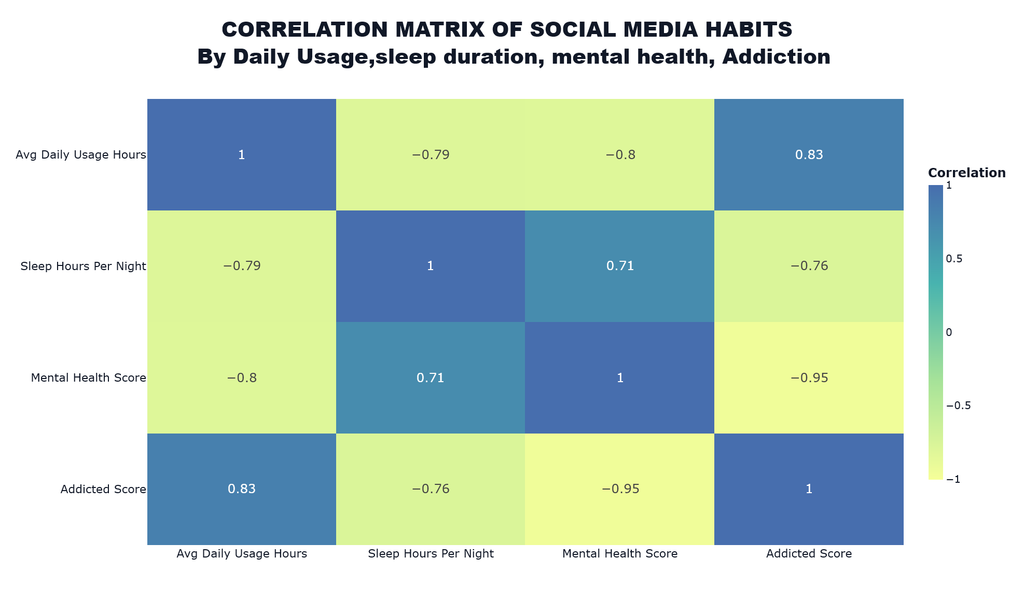
The relationship between addiction score and mental health is particularly striking, with a correlation of -0.95 the strongest negative relationship in the dataset. It implies that as social media addiction deepens, mental stability tends to decline sharply. Meanwhile, sleep hours and mental health (0.71) move in the same direction, suggesting that better rest is naturally linked to improved emotional balance.
Altogether, the correlation matrix doesn’t just visualize numbers it maps a rhythm of modern life, more connection, less rest, and a delicate balance between stimulation and serenity. The dataset doesn’t accuse or conclude, but it clearly reminds us that attention, when stretched too thin, always leaves something behind often, our peace of mind.
Conclusion: Connection Without Pause Cost Us Something.
From usage hours and sleep patterns to academic focus, mental well-being, and emotional conflicts, every data point traces one simple truth connection today is constant, and constancy comes with a cost. The dataset doesn’t accuse or alarm; it reflects how easily the human mind adapts to stimulation, even when it quietly erodes its own rest.
Across age, gender, and relationship status, the same rhythm repeats: the more people stay connected, the harder it becomes to stay centered. Social media has become both mirror and companion a space that nurtures creativity, belonging, and opportunity, yet also tests patience, attention, and peace of mind.
If there’s one insight the data leaves behind, it’s that balance isn’t found just in disconnection, but in awareness. Knowing when digital engagement turns into escape, and when sharing becomes seeking validation, might be the real skill of the digital age. Staying connected is easy it always has been. But staying emotionally balanced? That’s the new human challenge written between every scroll.
Data Source
The dataset used in this analysis was sourced from Kaggle and is licensed under Creative Commons Attribution 4.0 International (CC BY 4.0) license. Dataset published by Adil Shamim: Students’ Social Media Addiction, A Cross-Country Survey of Usage Patterns, Academic Impact, and Relationship.
Author’s Notes:
The analysis presented here is purely for educational and Exploratory Data Analysis purposes. This article is not a scientific study but a data analytics learning project based on publicly available datasets. Any statements should be understood within the context of the samples analyzed, not as universal conclusions. Results do not represent the global population, as cultural, environmental, and health factors may vary across groups.
Parts of the data analysis and visualization in this article i created by using Python, Pandas & NumPy Libraries, Scikit Learn, Plotly express. And i utilized Chat GPT.5 Codex to streamline and refine the code for better workflow. Hero Images was generated using Gemini: Nano Banana.