
Why We Shop That Way? Tracing the Logic Behind Every Shopping Behavior.
EDA: Uncovering what really shapes our buying decisions from discounts to delight.
Shopping isn’t just about buying things it’s a reflection of who we are, what we value, how is our lifestyle and sometimes, what mood we’re in. Behind every purchase lies a quiet pattern, a late-night impulse buy, a loyal customer returning for the fifth time, or a careful shopper waiting for the next big discount. This dataset consist of 100.000 rows of data that pulls back the curtain on that world.
From income to loyalty status, from how often we shop to how happy we feel afterward every data point tells a little story about human behavior in the marketplace.
The fun part? Seeing how these numbers connect to the way people actually live, choose, and spend. And as the last column telling about satisfaction score by the end of this exploration we also will focus on customer satisfaction.
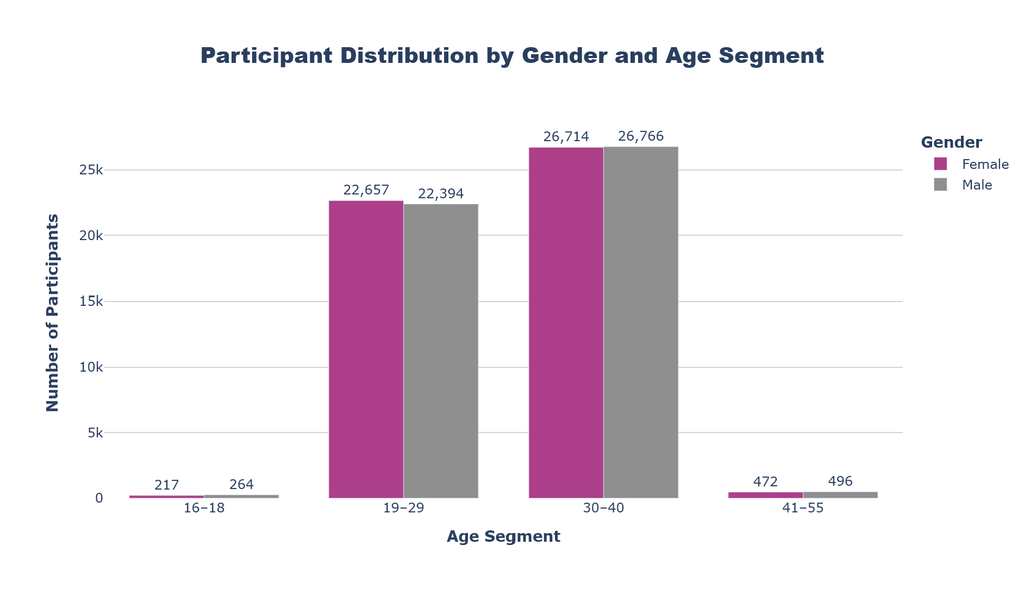
Before getting into what people buy and why, let’s first get to know who they are. Here’s the look at the buyer distribution after refining the age segmentation. Now, we’re grouping buyers into Teen/Entry Buyer: 16–18, Young Adult 19–29, Established Adult 30–40, and Mature Consumer 41–55, Senior Consumer 56–65, a setup that better reflects life stages rather than broad decades.
What’s immediately clear is that the 30–40 group takes the crown, with both male and female buyers showing almost identical numbers roughly 26,000 each. Right behind them is the 19–29 segment, another strong group of active spenders, likely representing younger professionals and early earners. Together, these two segments dominate the entire dataset, forming the backbone of today’s consumer market.
On the other hand, the 16–18 range barely shows up, with just a few hundred buyers and that makes sense. At this age, many are still students, not yet part of the full-time workforce, so their presence in the data likely reflects family-supported spending rather than independent purchasing power. The 41–55 group, while small, still holds steady possibly representing experienced professionals or parents whose spending habits are more focused and selective.
Interestingly, there’s a complete absence of senior consumers aged 56–65 in this dataset. The absence itself speaks volumes it might reflect how older generations are often underrepresented in digital or online shopping data, either because they shop less frequently online or aren’t as engaged in loyalty programs and digital surveys. In simpler terms, their voices don’t disappear from the market, but they often live outside the datasets that define modern consumer behavior. It’s a quiet reminder that data, as complete as it seems, still tells the story of those who are most connected not necessarily everyone who participates in the economy.
Overall, this segmentation makes one thing clear, the modern shopping economy is powered by young , mid-career adults to established adult, people who are both financially capable and emotionally driven to buy balancing wants, needs, and lifestyle all at once.
Then how much are the spendings for a year?
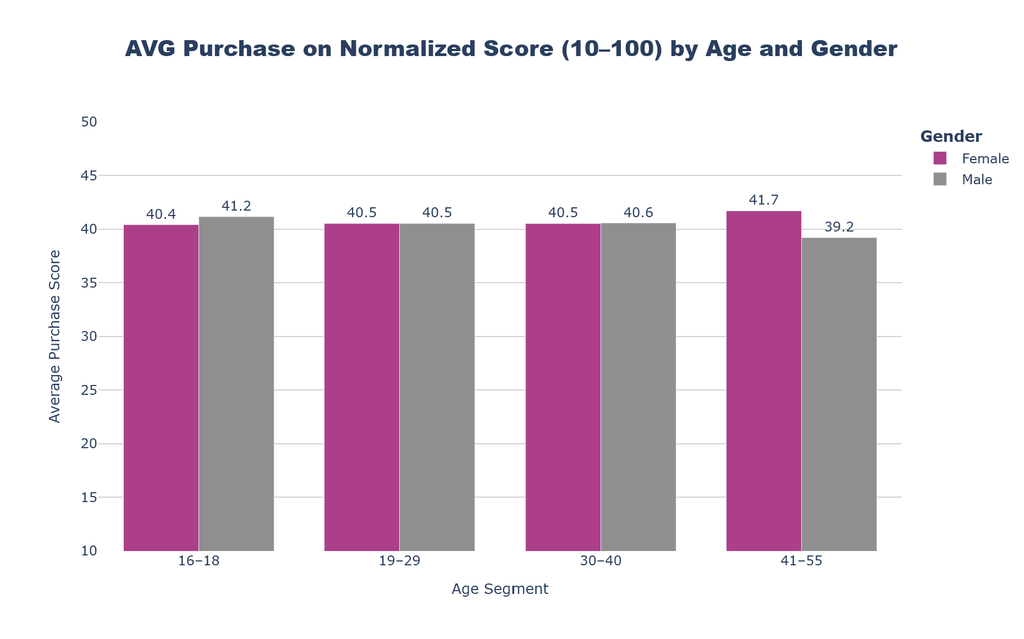
Since the dataset doesn’t specify which country or currency the spending data comes from, I decided to normalize the purchase amount into a point scaler from 10 to 100, where higher points represent higher yearly spending. By doing this, we can still compare purchase behaviors clearly without worrying about currency differences or price levels.
At first glance, spending between men and women looks balanced in the younger age segments (16–40), both hovering around the 40-point mark. But once we move into the 41–55 group, something changes women begin to pull ahead noticeably. Female buyers score 41.7, while males drop down to 39.2, marking the widest gap across all age ranges.
That shift is more than just a number. It reflects a deeper behavioral pattern as women grow older, their purchasing confidence and responsibility seem to rise, while men in the same range appear to dial back their spending.
It’s seemed not about financial limits, it’s about purpose. The Logic pattern that female consumers in this age segment are likely driving household purchases, wellness choices, and lifestyle upgrades spending strategically, not impulsively.
Meanwhile, the age segments 19–29, and 30–40 show near-identical patterns between genders, sitting around 40–41 points and still showing this age range as very potential buyer with this avg yearly spendings point.
But the second surprise comes from the youngest group the 16–18 teen/entry buyers. Despite being at the very beginning of their financial independence, this segment records an impressively high average purchase score of around 40, almost on par with older adults. How can that be? The most plausible explanation lies in family financial influence. Many teenagers don’t spend their own income; instead, they often shop using family-supported budgets or parental funds. In other words, this isn’t purely teen spending power it’s family spending expressed through younger consumers.
From a commerce perspective, this difference matters. It tells brands that the female mature-consumer segment might be the most decisive and value-driven group in the dataset one that shops with purpose and isn’t afraid to spend when the value feels right.
And who really buying things the most often?
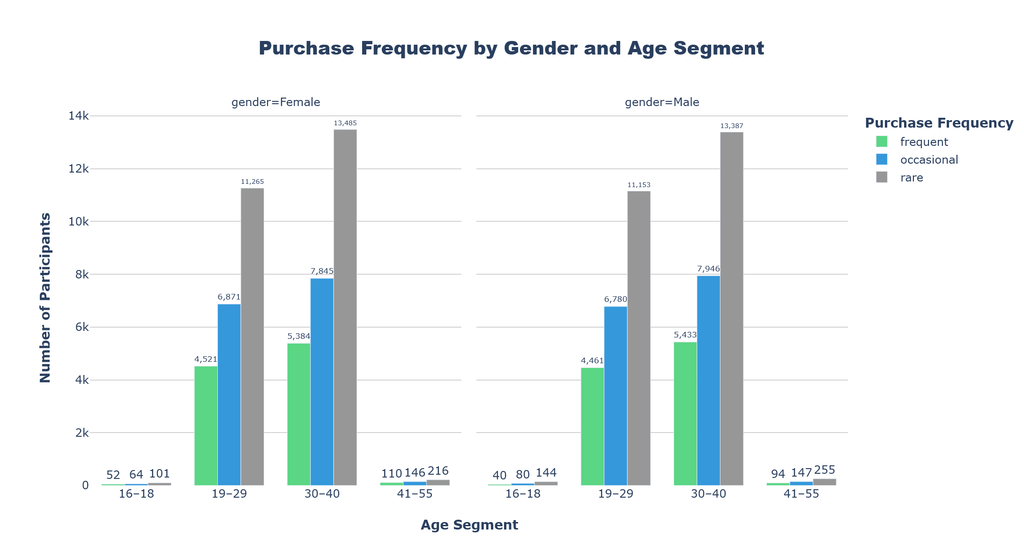
Now that we’ve seen how much people spend, the next question is simple who’s actually buying the most often?
To find out, I looked at the purchase frequency by both gender and age segment. The chart breaks it down into three groups, frequent, occasional, and rare buyers.
The results show a clear pattern: most buyers fall into the “rare” category, meaning they shop occasionally rather than habitually. This holds true for both men and women. However, the 30–40 segment dominates overall with over 13,000 rare buyers in each gender group, they’re clearly the largest portion of steady but selective consumers. The 19–29 segment follows closely, maintaining strong engagement and purchase activity, especially among those who shop occasionally or frequently.
Interestingly, younger buyers (16–18) barely register just a few dozen transactions while the 41–55 group stays modest but consistent, showing that spending activity tends to peak around people’s career and family stability years (30s to early 40s) before gradually slowing down.
The gender gap? Practically nonexistent. Men and women seem to follow almost identical shopping rhythms, suggesting that purchase frequency today is shaped more by lifestyle and stage of life than by gender differences.
So, if we’re asking who’s buying the most the answer is clear the 30–40 crowd. They might not shop impulsively, but they shop steadily the heartbeat of modern consumer behavior, this might also because in the age range is tendency having more higher lifestyle with a better income and cashflow.
But what are they actually spending all that money on?
Whether you’re in business or just a regular shopper, this matters knowing what people buy most helps brands put their energy where it really makes a difference.
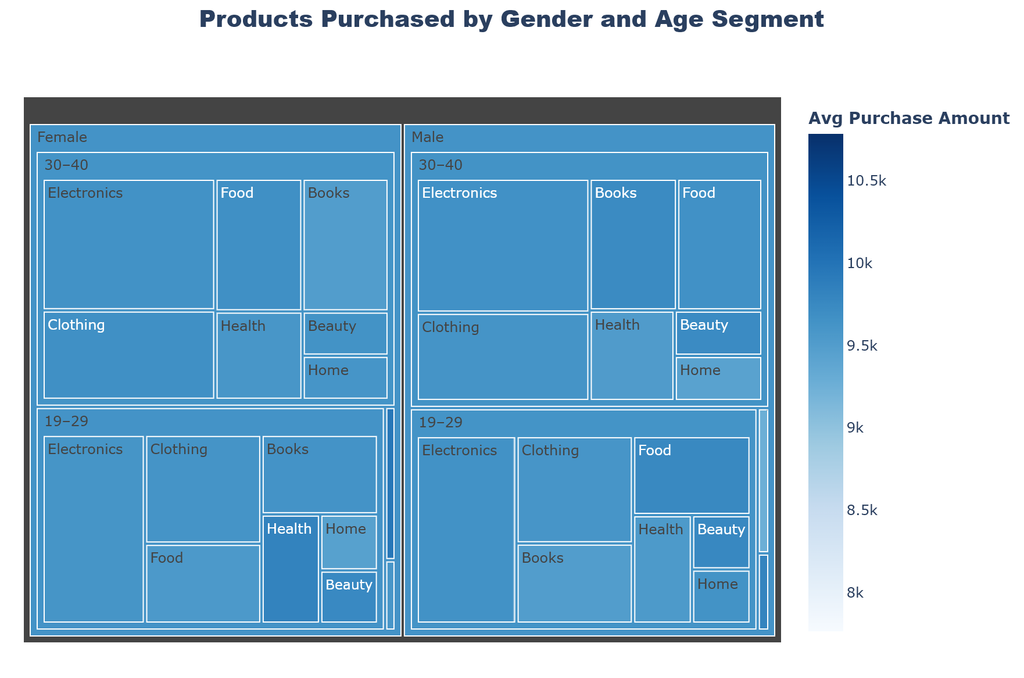
This Tree map breaks down products purchased by gender and age segment ( Bigger are means higher amount/counts), and as focus i just showing the sample of 2 main shopper age ( 19–40) , to showing which categories dominate spending. The larger the box, the bigger the slice of total spending that category represents.
Across both men and women, one category towers above the rest: Electronics. Whether it’s phones, laptops, or gadgets, tech clearly captures the biggest share of wallets especially among the 19–40 segment, where digital lifestyle and connectivity drive most purchasing decisions. In short, everyone wants to stay plugged in.
For female buyers, electronics are followed closely by clothing, food, and health-related products. This mix reflects a balance between lifestyle essentials and self-care shopping that feels both practical and personal. Interestingly, beauty products appear smaller in total spending, suggesting that while women do buy them, they’re not the largest financial driver, rather, tech and daily needs take the lead.
Meanwhile, male buyers show a very similar structure. Electronics dominate again, with strong spending on books and clothing, hinting that men are both tech-oriented and experience-driven spending on tools and learning rather than indulgence. Health and home products appear as smaller but steady categories, suggesting consistent, functional buying habits.
One subtle insight hides within this visual, the 30–40 age group anchors nearly every category. They’re the backbone of consumer spending buying broadly across tech, fashion, food, and health a perfect reflection of their life phase: working, earning, and balancing personal and family needs.
It’s not surprising that electronics take the lead for both male and female shoppers because in today’s world, tech has quietly become the new “essential”, and that is a very logic reason. Gadgets are no longer just tools; they’re extensions of daily life. Phones, laptops, wearables, and smart devices connect us to work, entertainment, and each other.
For men, electronics often represent function and curiosity the excitement of upgrading, optimizing, and exploring new features. For women, the story is equally strong but slightly different, tech often plays a role in productivity, self-expression, and lifestyle convenience, from mobile devices that manage routines to gadgets that support health and creativity.
But overall the data shows that shopping isn’t just about products it’s about maintaining lifestyle, identity, and belonging.
And here, I wanted to explore the “Economic Side” of shopping does having a higher income actually make people spend more?
For this analysis, I set income on equal terms for both male and female buyers and here’s what the data revealed.
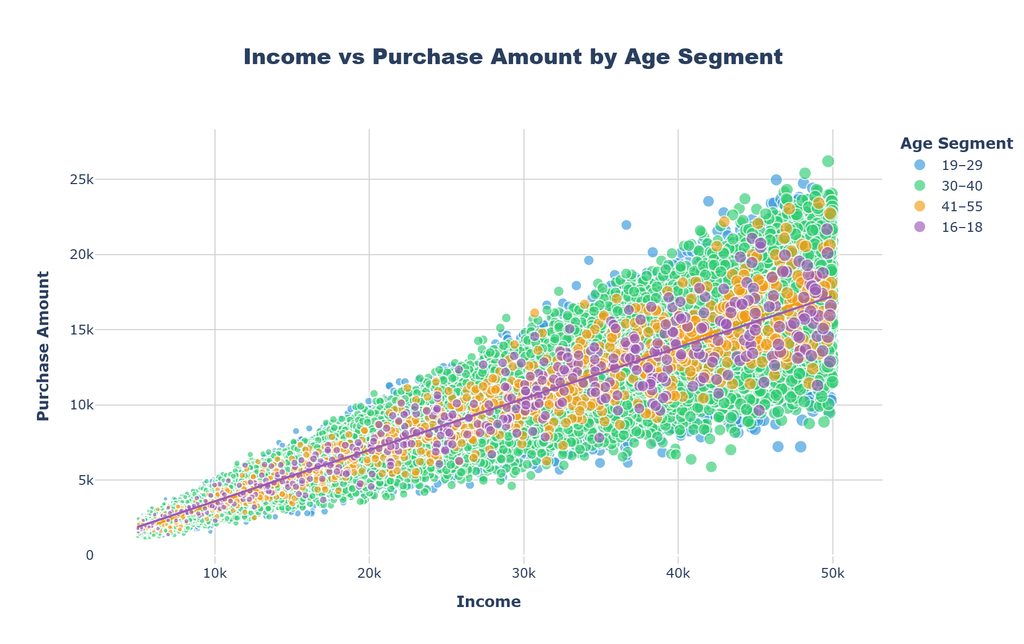
Now that we know who’s buying and how often, the next question naturally comes up does earning more actually make people spend more?
The scatter plot above shows Income vs Purchase Amount, separated by age segment, and the answer is beautifully simple: yes, but not equally for everyone. The upward trend in the regression line confirms that higher income generally leads to higher purchase amounts the classic economic logic still holds true. But when we look closer, the pattern gets much more interesting.
The 30–40 segment (green dots) dominates the middle-to-upper range, filling out the densest part of the chart. This group not only earns more but also spends more consistently, suggesting they’re the main financial engine of this dataset. They’re likely full-time professionals or business owners people in their career peak, balancing stable income with lifestyle spending.
The 19–29 group (blue) also shows a strong cluster, though slightly below the 30–40 line. This makes sense they’re early earners, still building financial and careers but already active spenders, eager to explore and experience. Interestingly, even with slightly lower income, their purchase amounts aren’t far behind, hinting at a willingness to stretch budgets for lifestyle or brand-driven items.
The 41–55 segment (orange) sits close to the same pattern, though more compressed. Their income and spending relationship looks steadier fewer outliers, fewer splurges. It feels like a group that knows their limits and spends with intention rather than impulse.
And then there’s the 16–18 group (purple). Their dots cluster low on both axes limited income, smaller spending but what’s fascinating is that their slope still follows the same upward path. Even with pocket money or family support, the logic stays consistent, the more they have, the more they spend.
Overall, the relationship between income and purchase amount isn’t linear just in math it’s emotional, too. People spend not only based on what they earn but also how they feel about that income. For some, more money means more comfort; for others, it’s an opportunity to enjoy a bit more of life.
Let’s be honest everyone loves a good deal. Spending money feels a lot better when it feels smart, and that’s exactly what promotions are made for.
But who really use the promo (e.g. Discount) most of the time?
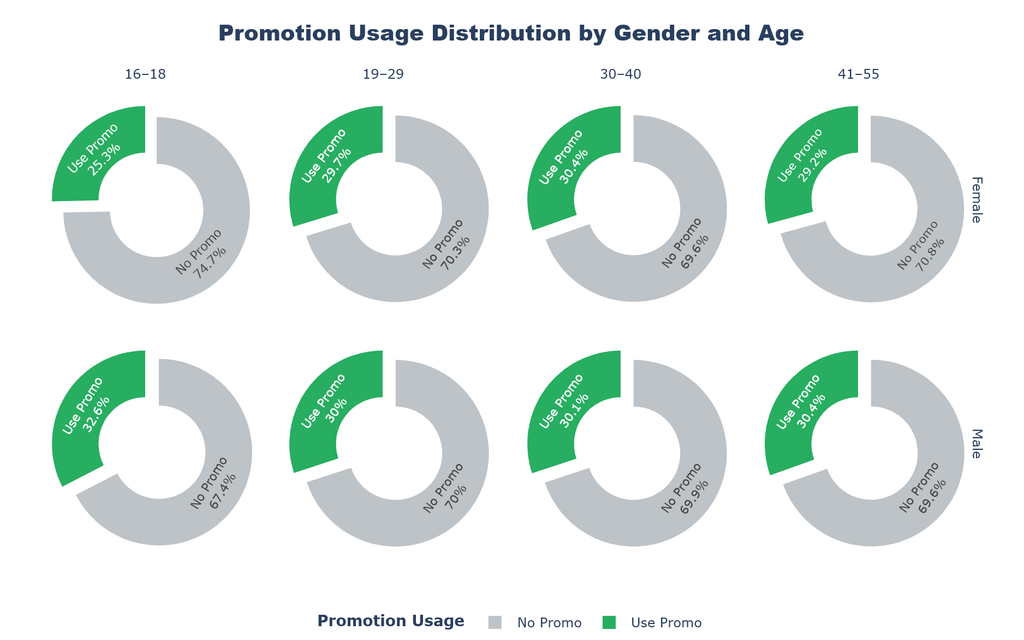
Promotions can tell you a lot about shoppers not just how much they want to save, but how they approach buying. Some people treat discounts like a sport, hunting for the best deal. Others barely notice them at all.
This chart compares promotion usage by gender and age, showing who actually takes advantage of discounts when making a purchase.
The most eye-catching pattern is that male buyers consistently use promotions more than females across every age segment. Their promo usage starts at 32.6% for the youngest group (16–18) and peaks at 39.4% for the 41–55 segment, which makes them the most promotion-engaged shoppers overall. Men seem to become more promo-aware as they age perhaps becoming more practical or value-conscious with experience.
For female buyers, promo usage stays relatively steady, between 25% and 30%, showing less variation across age. The 30–40 group leads slightly among women, with 30.4% using promos, followed closely by 19–29 and 41–55. This steadiness could reflect consistent buying habits where convenience or brand trust matters more than waiting for discounts.
Another detail worth noting younger shoppers (16–18) have the lowest promo participation for both genders, which makes sense. They’re likely less financially independent and may not be directly handling payments, meaning discounts aren’t their main decision factor. Even if they are the highest among all but that can’t be used to make them the real one who use the promo the most ( remember the count of participant of this age group, is not high).
So, who uses promos the most? Clearly, men aged 41–55 take the top spot for the male gender. They’re strategic, experienced, and deliberate buyers the type who check deals, compare prices, and buy smart. Meanwhile, women across all ages show more consistency, proving that for many, shopping isn’t just about saving money it’s about getting what feels right.
Let’s Focus on the emotional payoff. How loyalty status and satisfaction quietly connect.
It’s not just about points or perks it’s about how loyalty makes people feel.
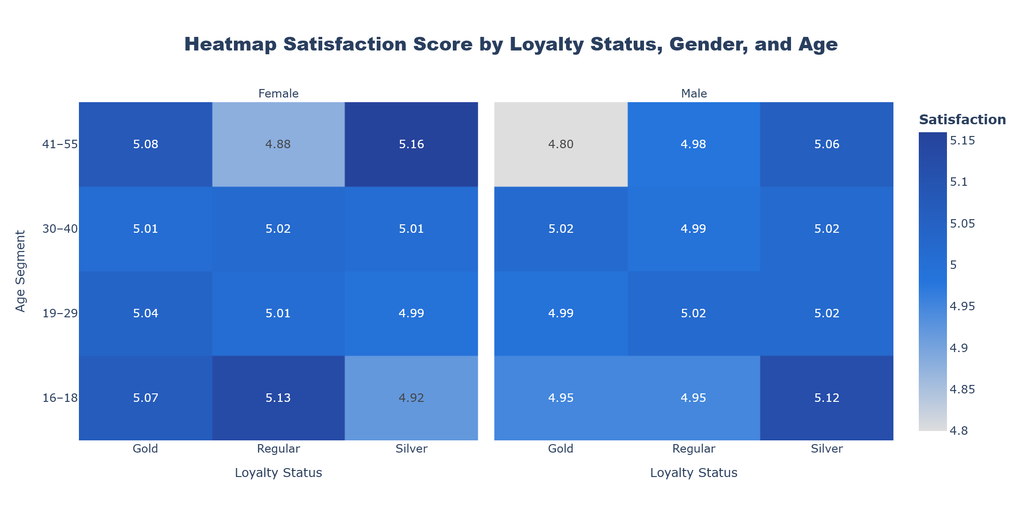
This heatmap shows the average satisfaction scores, grouped by loyalty status, gender, and age segment. And level of loyalty will be Regular, silver and Gold.
The first thing to notice is that the scores sit in a very narrow range, between 4.8 and 5.1, meaning that overall satisfaction remains fairly stable regardless of gender or loyalty level. In other words, no group seems dramatically happier or less satisfied than the others which is an interesting finding by itself.
Still, a few subtle patterns emerge. For female buyers, satisfaction tends to rise slightly in the Gold and Silver loyalty tiers, especially among the 16–18 and 41–55 age segments. That suggests that recognition or perks from loyalty programs may play a small but noticeable role in how women perceive value and satisfaction. Meanwhile, Regular female buyers aged 41–55 show the lowest satisfaction at 4.88, hinting that staying loyal without receiving clear benefits may feel less rewarding.
For male buyers, the picture is slightly different. Satisfaction scores are also consistent, but the Silver members across most age groups quietly edge ahead. Males aged 41–55 Silver score around 5.06, suggesting that small incentives and flexible loyalty structures might work better for this group than high-tier exclusivity.
What this tells us is that loyalty alone doesn’t guarantee satisfaction it’s how the loyalty feels that matters. Shoppers value recognition, fairness, and small gestures that make them feel appreciated. Even when spending habits differ, the emotional side of buying that sense of being seen seems to be what keeps people happy.
And will a promotion increases the satisfaction score among the buyers?
Now that we’ve looked at loyalty and satisfaction, the next question practically asks itself does using promotions actually make buyers happier?
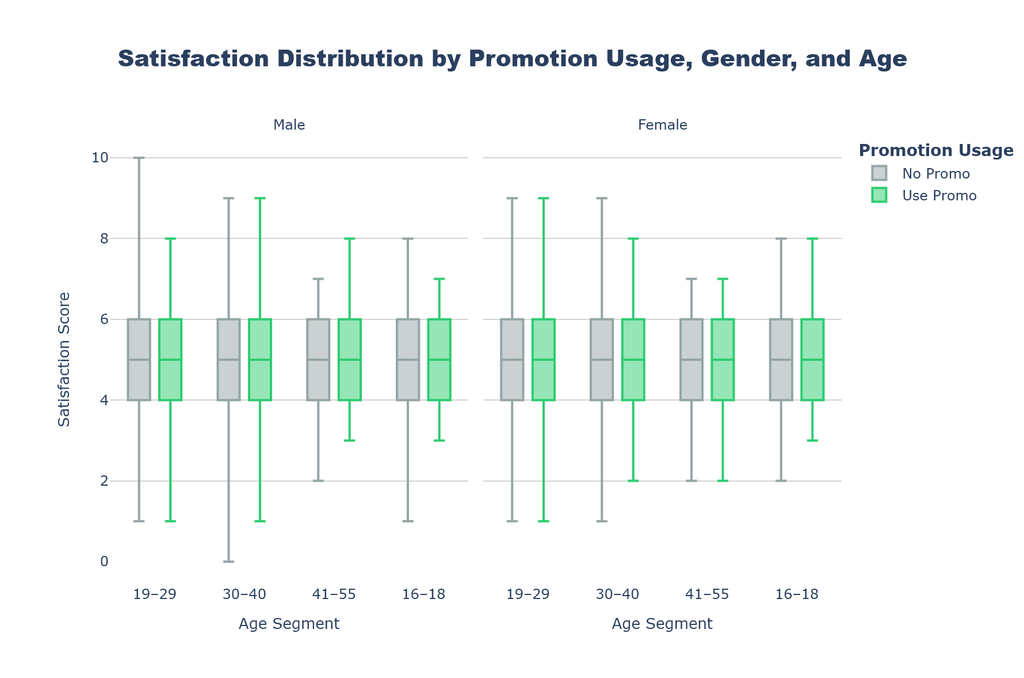
This visual shows something quite balanced. Across every age segment and gender, the satisfaction scores of promo users (green) and non-promo buyers (gray) stay almost identical. Most hover around a median score of 5 out of 10, with a few outliers stretching higher or lower. That means promotions don’t necessarily guarantee happier customers at least not in a measurable, lasting way.
But there’s a deeper insight here when viewed from a commerce perspective. For retailers, promotions are less about increasing satisfaction directly and more about increasing engagement and conversion the spark that gets a buyer to act. The emotional lift from a discount is often short-lived; what really defines satisfaction happens after the purchase: product quality, delivery experience, and post-sale support.
That said, a few subtle patterns are still worth noting. Promo users especially female buyers aged 16–18 and 19–29 show slightly higher upper ranges in satisfaction, hinting that younger consumers may feel more rewarded by promotional deals. For them, it’s not just about saving money; it’s about the excitement of getting a good catch.
So, while promotions may not dramatically change overall satisfaction, they do play a crucial role might in triggering the joy of purchase. They’re the emotional handshake that brings the buyer closer to the brand and if what follows is good, that joy turns into trust.
But in the end, every aspect of customer behavior circles back to one thing: ‘satisfaction’.
From the world of commerce, a satisfied customer is everything they buy more, return often, and stay loyal without needing reminders. But from the buyer’s side, satisfaction feels a little different. It’s not just about spending money or collecting points; it’s about trust knowing the brand keeps its promises, the product works as expected, and the experience feels effortless from start to finish.
That’s why it’s worth also asking does gender play a real role in how promotions influence satisfaction? Because looking at the earlier charts, the answer isn’t that clear. The numbers don’t seem convincing enough to say promotions alone make people happier. So, let’s dig a little deeper and see if there’s more to uncover beneath the surface.
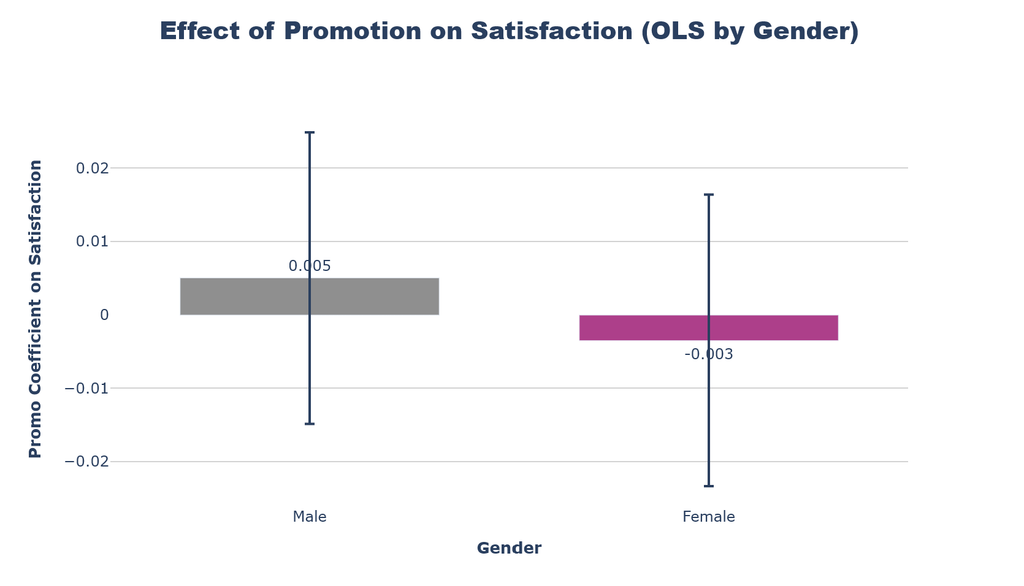
So here’s what the regression result tells us and it’s surprisingly subtle.
When looking at the effect of promotions on customer satisfaction, separated by gender, the bars show almost no significant difference. The coefficient for males sits slightly positive at +0.005, while for females it’s slightly negative at –0.003.
In plain language, that means using a promotion has almost no measurable impact on how satisfied a customer feels after purchasing whether they’re male or female. Even though men show a marginal positive link, it’s too small to say promotions truly make them happier. For women, the result even dips a little below zero, hinting that discounts alone don’t create joy experience does.
From a commerce perspective, this insight is crucial. It suggests that while promotions may attract attention and trigger purchases, they don’t necessarily build emotional loyalty. Shoppers might appreciate the deal in the moment, but what keeps them satisfied and coming back goes beyond price. Things like product quality, brand trust, service experience, and after-sales care are the real pillars of satisfaction. In short, promotions can bring people to the door but it’s the overall experience that convinces them to stay.
So what is exactly drive a customer satisfaction?
From a customer’s point of view, satisfaction isn’t just about spending less or getting more it’s about feeling good about the choice they made. It’s when the product works exactly as promised, when the delivery arrives faster than expected, or when customer support actually listens and helps. It’s that small sense of trust that builds every time a brand does what it says it will. Promotions may sweeten the deal, but what really makes people stay is consistency and care.
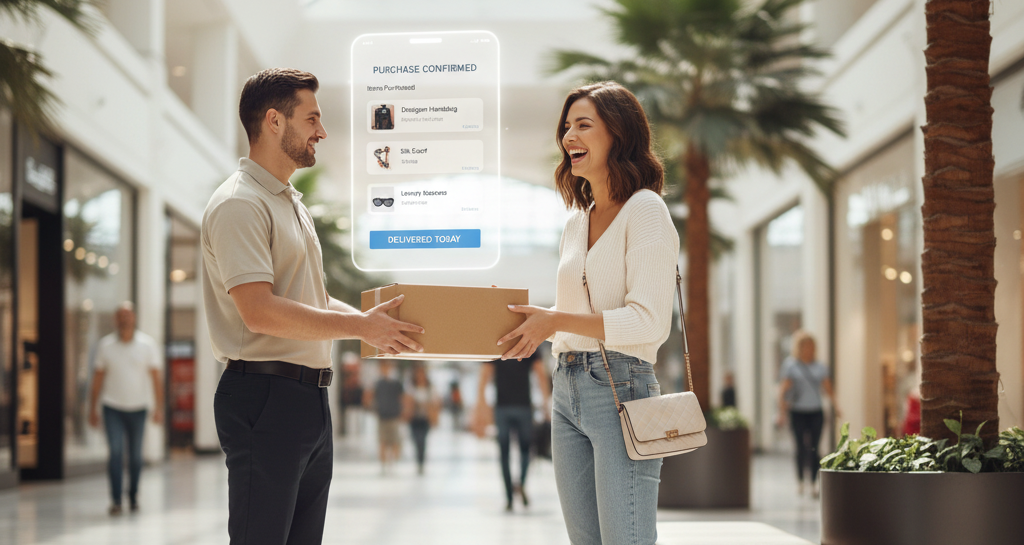
Meanwhile from a commerce perspective, the story flips slightly. Discounts and loyalty programs may drive traffic, but they’re only the beginning of a relationship. The real game is experience management turning a one-time buyer into a returning one by delivering seamless service, genuine personalization, and emotional connection. In other words, satisfaction isn’t bought it’s earned, make one positive moment and shopping journey at a time.
Data Source
The dataset used in this analysis was sourced from Kaggle and is licensed under License Apache 2.0. Dataset published by Omar Sanyam Goyal: Customer Purchases Behaviour Dataset.
Author’s Notes:
The analysis presented here is purely for educational and Exploratory Data Analysis purposes. This article is not a scientific study but a data analytics learning project based on publicly available datasets. Any statements should be understood within the context of the samples analyzed, not as universal conclusions. Results do not represent the global population, as cultural, environmental, and health factors may vary across groups.
Parts of the data analysis and visualization in this article i created by using Python, Pandas & NumPy Libraries, Scikit Learn, Plotly and Altair. And i utilized Chat GPT Codex to streamline and refine the code for better workflow. Hero Images was generated using Gemini: Nano Banana.