
Monthly Recruitment Report
Monthly Recruitment Report
Short description
A complete monthly recruitment reporting pack covering seven key indicators against target, open vacancy status by stage, a recruitment funnel by source with hire rate, new hires, probation results and early leavers, full cost reporting against budget, and a structured analysis and action plan. Form coded, revision controlled, submitted to the General Manager, and the final document in a ten form recruitment system.
Purpose
Recruitment is usually discussed anecdotally. Somebody mentions that a position has been open a long time, somebody else says candidates are asking for too much money, and the conversation ends without a number attached to either claim. Meanwhile the real questions go unanswered, namely which sourcing channels actually produce hires, what each hire costs, how many new employees are leaving within three months, and which positions are stuck and at what stage.
This report answers all of them, on a fixed monthly cycle:
- It reports against target, not in isolation. Each indicator carries its target, this month’s figure, last month’s figure, and an on or off target marker, so performance is immediately readable.
- It exposes where vacancies are stuck. Open positions are listed with their stage, namely sourcing, screening, interview, trade test, reference check, offer or pre employment, and days elapsed, with an instruction to flag anything beyond the target time to fill.
- It measures sourcing channels properly. A funnel across eight sources tracks applicants through shortlist, interview, offer and hire, with a hire rate calculated for each, and an explicit instruction to use it to decide which sources to keep, increase or stop.
- It links recruitment to retention. Probation results and ninety day leavers appear in the same report as hiring volume, which is the only way to see whether the hiring is actually working.
- It costs the function. Five cost lines are reported against budget with variance, covering advertising, agency fees, medical checks, candidate travel and other costs.
- It demands analysis, not just data. The final section requires achievements, main issues with causes, an action plan for the following month, and a statement of support needed from management.
It suits HR managers reporting to ownership or a general manager, management companies monitoring recruitment across a portfolio, properties with unexplained hiring delays or costs, and any operation that has never known which recruitment channel actually works.
What is inside the document
A structured report in nine numbered sections.
1. Form header and Section 1, Report Details
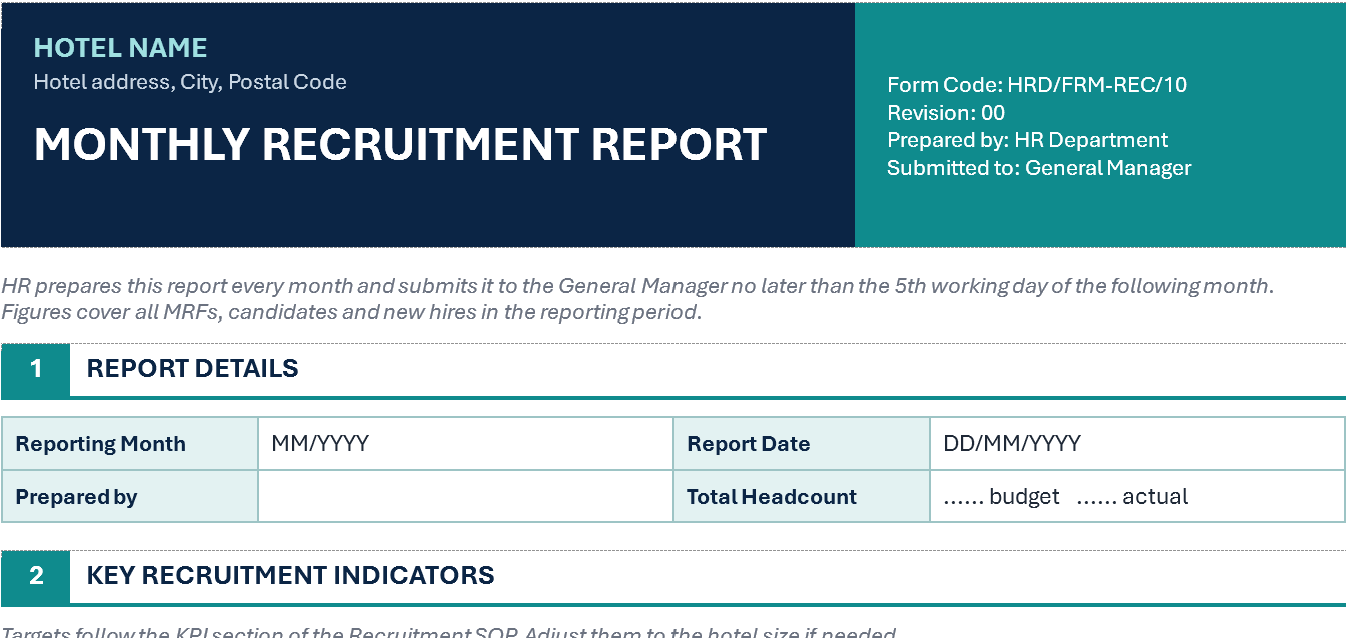
A header carrying the hotel name, address, form title, form code HRD/FRM-REC/10, revision number, preparer and recipient, with an instruction requiring submission to the General Manager no later than the fifth working day of the following month.
Report details then record the reporting month, report date, preparer, and total headcount showing budget against actual, which frames every other figure in the report against establishment.
2. Section 2, Key Recruitment Indicators
Eight lines in a six column grid showing the calculation method, target, this month, last month, and an on or off target marker:
- Open MRF, approved requisitions not yet filled at month end.
- Positions Filled, new hires who started this month.
- Average Time to Fill, days from MRF approval to offer acceptance, with targets by level.
- Offer Acceptance Rate, offers accepted divided by offers made.
- Cost per Hire, total recruitment cost divided by positions filled.
- Probation Pass Rate, passed divided by evaluated.
- New Hire Turnover, leavers within ninety days divided by hires.
- Internal Fill Rate, positions filled internally divided by total filled.
Including last month alongside this month in every row is what turns a report into a trend, and it costs nothing to collect.
3. Section 3, Vacancy Status
An eight row table recording MRF number, position, department, MRF date, current stage, days elapsed and remarks for every open requisition, with the seven stages named in the instruction and a requirement to flag anything running beyond target.
This is the section a General Manager will read first, because it converts a vague sense that hiring is slow into a specific list with a specific bottleneck.
4. Section 4, Recruitment Funnel by Source
A nine row funnel across eight sources, namely online job portal, social media, employee referral, walk in, internal transfer or promotion, agency, school or campus, and other, tracking applicants, shortlisted, interviewed, offered, hired and hire rate, with a total row.
The instruction states the calculation and its purpose directly, namely to decide which sources to keep, increase or stop. That single sentence is what makes this the most financially useful section in the report, since recruitment spend is usually allocated by habit rather than by performance.
5. Sections 5 and 6, New Hires, Probation Results and Early Leavers
A six row new hire table recording name, position, department, start date, employment status and source, and a four row table recording probation and early departure events with name, position, department, event marked as passed, not passed or resigned, date and reason.
Recording the source on each new hire line allows the funnel in Section 4 to be verified rather than estimated, and placing probation results beside new hires in the same report connects hiring decisions to their outcomes.
6. Section 7, Recruitment Cost
Six lines covering job advertising and portals, agency or headhunter fees, medical check ups and tests, candidate travel and accommodation, other costs, and a total, each with budget, actual and variance.
Breaking cost into five named categories rather than reporting a single figure is what makes the cost per hire indicator actionable, since a rising cost per hire driven by agency fees calls for a different response from one driven by medical checks.
7. Section 8, Issues, Analysis and Action Plan, and Section 9, Signatures
Four analysis blocks covering key achievements, main issues and causes with hard to fill positions, low offer acceptance and salary gaps against competitors given as prompts, the action plan for the following month, and support needed from management.
The report closes with a three column signature block for the preparing HR Officer, the checking HR Manager, and the approving General Manager.
The support needed field is a quietly important inclusion, because most recruitment problems are not solvable by HR alone. A salary gap against competitors requires an ownership decision, and this field gives HR a structured place to say so every month.
What you gain
- Recruitment managed by number rather than by impression.
- Bottlenecks identified by stage, so delays can be addressed rather than merely noted.
- Sourcing spend directed by hire rate, which is where the fastest saving usually sits.
- Hiring quality visible, through probation results and ninety day turnover reported alongside volume.
- Full cost transparency against budget in five categories.
- A monthly discipline, through a fixed submission deadline and three signatures.
- Escalation of what HR cannot solve alone, through a dedicated support needed field.
- Direct compatibility with the Effective Recruitment Procedure SOP, whose KPI section this report operationalises.
Owner: Oka Witantra
© 2026 Oka Witantra. All rights reserved.
Website: www.okawitantra.com
This document, including its design, layout, wording, structure and documentation, is the intellectual property of Oka Witantra. The downloader is granted a single user licence to use and adapt this document for the internal operation of their own property or organisation. Reproduction, redistribution, resale, sublicensing or publication of this document, in whole or in part, is not permitted without prior written permission from the author.
All names, codes and figures shown in this document are sample data for illustration only.
Download link:
Monthly Recruitment Report