

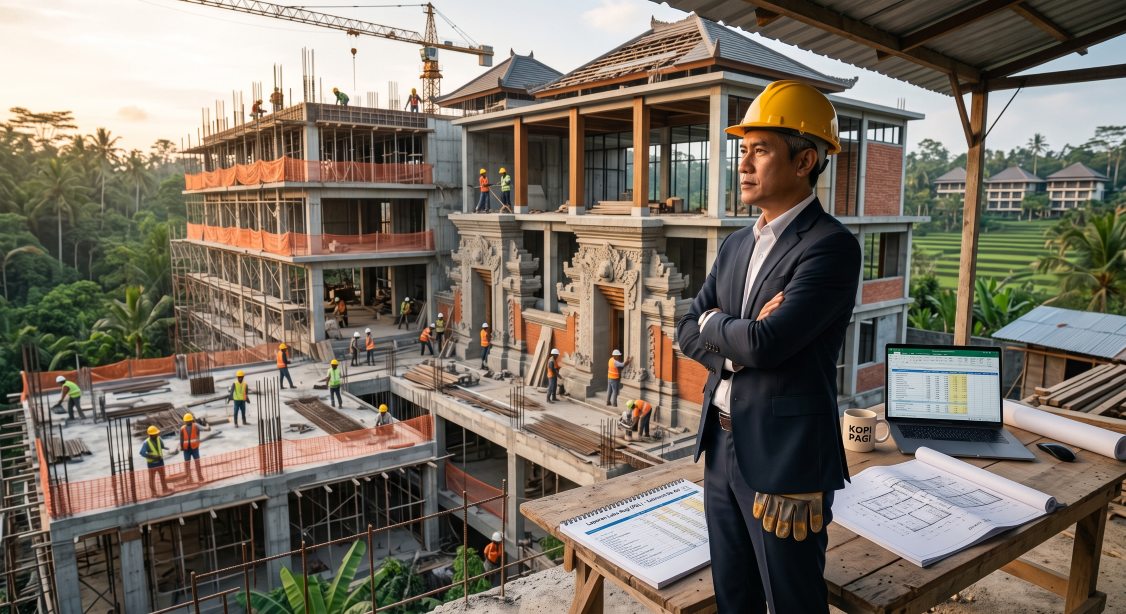
Before the First Guest Arrives, The Real Cost of Opening a Hotel
There is a particular silence in a hotel that has not yet opened. The lobby is finished, the furniture is wrapped in protective plastic, and the corridors smell of fresh paint. By every visible measure the property is almost ready. Financially, though, it has already been spending money for months, sometimes more than a year, without earning anything. This is the pre-opening period, and it is where many hotel investments quietly lose their margin for error before the first booking is ever confirmed.
A pre-opening budget is the financial plan for everything required to take a completed building and turn it into an operating hotel. It is separate from construction cost and separate from the operating budget that begins after opening. It sits in the gap between the two, which is exactly why it is so often underestimated. Construction budgets belong to the developer. Operating budgets belong to the management team. Pre-opening costs belong, in practice, to everyone and no one, until the money starts running short.
“Construction produces a building. Pre-opening produces a business. The two are funded from different mental accounts, and the second one is almost always underfunded because nobody owned it early enough.”
The largest component of most pre-opening budgets is payroll, and it surprises people every time. A hotel cannot hire its entire team the week before opening. Key positions come first: the general manager, the director of sales, the executive chef, the chief engineer, the financial controller, and the heads of rooms and F&B. These people are typically needed six to twelve months ahead, because they build the systems, write the SOPs, select suppliers, and recruit everyone else. Line staff then join in waves, timed to allow thorough training before opening. Each wave adds payroll cost for a hotel that has no revenue yet.
“The hiring curve in a pre-opening hotel is a financial decision disguised as an HR schedule. Bring people in too early and the budget bleeds. Bring them in too late and the hotel opens with an untrained team, which costs far more in guest experience and reputation than the payroll ever saved.”
Beyond payroll, a realistic pre-opening budget covers several other categories. Sales and marketing begins well before opening, since a new hotel has no booking history, no reviews, and no distribution presence. Websites, photography, channel setup, travel trade introductions, and launch campaigns all need funding while there is nothing yet to sell against. Recruitment and training costs cover advertising, assessment, uniforms, and the cost of running a proper training program rather than hoping people will learn on the job. Opening inventories cover operating supplies and equipment, usually called OS&E, along with the initial stock of food, beverage, linen, amenities, and cleaning materials, all of which must be bought before a single dollar of revenue arrives. Technology covers property management systems, point of sale, network infrastructure, and the integrations between them. Licenses, permits, legal fees, and insurance round out the list, along with utilities during commissioning, when systems run at full cost with no guests in the building.
A small number of items consistently get forgotten or understated. Soft opening and trial operations are one. Most responsible hotels run a period of practice service with staff, friends, and invited guests, and that period consumes real food, linen, and labor. Contingency is another. A pre-opening budget with no contingency is simply a hope that nothing will go wrong, in an industry where something always does.
“The most expensive words in pre-opening are ‘we will open on the planned date.’ Every month of delay means payroll already committed, marketing already launched, and loan interest already accruing, all against a building that cannot yet earn.”
This is the reason delay deserves its own line in the thinking. Construction delays are common, and they rarely arrive alone. A hotel that has already hired its key team and begun its marketing carries a monthly burn rate whether the doors open or not. A responsible pre-opening plan calculates that burn rate explicitly and tests what a three-month or six-month delay would do to total funding needs.
The financial projection that follows the pre-opening budget is where the story continues. A new hotel does not open at stabilized performance. It climbs toward it over several years, and the shape of that climb determines how much cash the project consumes before it begins to pay itself back. A sound five-year projection models occupancy and ADR separately by year, reflecting how a new property builds awareness, earns reviews, and wins repeat and group business over time. It separates fixed costs from variable costs, because fixed costs are present from day one at full weight while variable costs scale with activity. This is why early years often show negative or thin GOP even when the long-term economics are perfectly sound.
“Year one of a new hotel is rarely a profit story. It is a funding story. The question is not whether the hotel loses money in the early period, but whether the project has been funded to survive that period without being forced into bad decisions.”
That brings the analysis to working capital and financing. The cash required to carry a hotel through its ramp-up is a real and often substantial number, and it belongs in the total project funding requirement rather than being discovered later. If the project carries debt, the early years also test debt service coverage, since interest and principal come due while operating profit is still building. Many financially sound hotels have faced distress in their second year, not because the concept failed, but because the funding plan assumed an easier ramp-up than the market delivered.
A few practical disciplines separate disciplined pre-opening planning from optimistic planning. Build the budget by category and by month, not as a single lump sum. Tie hiring dates to the opening date and to a realistic training calendar. Include contingency, and treat it as a genuine reserve rather than a negotiating cushion. Model delay scenarios before they happen. Reconcile the ramp-up assumptions with the market evidence from the feasibility study, so the two documents tell the same story. And track actual pre-opening spend against budget monthly, because overruns in this period compound quickly when there is no revenue to absorb them.
For anyone who will one day lead a pre-opening team, the most valuable perspective is this: the pre-opening period is where the hotel’s financial future is written. Decisions about when to hire, how much to spend on launch, and how much cash to hold in reserve will shape the first three years of operating results more than most of what happens after the doors open. The numbers in a pre-opening budget are not administrative preparation. They are the first chapter of the hotel’s financial story, and they deserve to be treated that way.
Pre-Opening Budget Calculator
Estimate what it costs to get a hotel ready to open, before the first guest checks in.
How the pre-opening budget is built
| Timeline | What usually happens |
|---|---|
| M-12 to M-9 | Key staff (GM, Finance, Sales, Engineering) join. Systems and brand standards set. |
| M-8 to M-4 | Sales push, OTA contracting, supplier selection, supervisors hired. |
| M-3 to M-1 | Line staff hired and trained, OS&E delivered, soft tests, trial operations. |
| M0 | Opening. Revenue starts, burn rate flips to operating cost. |
Pre-opening cost is spent before any revenue exists, so it must be funded, not earned.
Cost Estimator
Category share
Benchmark
| Hotel segment | Pre-opening as % of total project cost |
|---|---|
| Budget / economy | about 3% to 4% |
| Midscale / upscale | about 4% to 5% |
| Luxury / full service | about 5% to 6% |
| Reference | Indicative figure |
|---|---|
| US select-service, about 150 rooms | roughly USD 4,000 to 6,000 per key |
| Pre-opening plus working capital (combined) | often quoted at 4% to 6% of project cost |
Hiring Curve
| Wave | Heads | Start | Cost |
|---|---|---|---|
| Key Staff | 8 | M-9 | Rp 1,800,000,000 |
| Supervisors | 15 | M-5 | Rp 540,000,000 |
| Line Staff | 60 | M-2 | Rp 660,000,000 |
Delay Simulator
| Delay | Extra cost |
|---|---|
| 3 months | Rp 3,900,000,000 |
| 6 months | Rp 7,800,000,000 |
| 9 months | Rp 11,700,000,000 |
5-Year Projection
| Year | Occ | ADR | GOP |
|---|---|---|---|
| 1 | 50% | 1,350,000 | 3.5% |
| 2 | 75% | 1,425,000 | 28% |
| 3 | 90% | 1,500,000 | 38% |
Funding and DSCR
| Item | Value |
|---|---|
| Peak cash deficit | Rp 4,070,000,000 |
| Total funding need | Rp 22,300,000,000 |
| Year 2 DSCR | 2.2x |